Figures & data
Table 1. Composition of oxybutynin chloride proniosomal gels.
Table 2. Entrapment efficiency and vesicle size of hydrated proniosomes.
Table 3. Change in entrapment efficiency after storage for 3 months.
Figure 1. Optical microscope images. (A, B) P3 gel with lower and higher levels of hydration, respectively; (C, D) P4 gel with lower and higher levels of hydration, respectively.
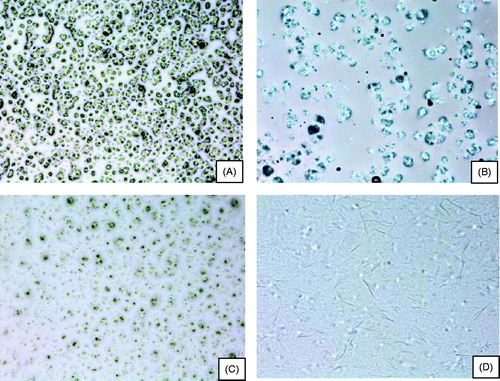
Figure 2. Hydrated P3 proniosomal formulations A, B and C (with magnifications of 500×, 1000× and 2000×, respectively): hydrated P4 proniosomal formulations D, E and F (with magnifications of 500×, 1000× and 2000×, respectively).
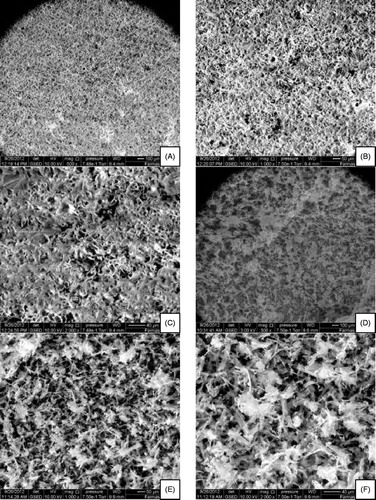
Figure 3. ATR-FTIR spectra of P3 proniosomal gel and its individual components.
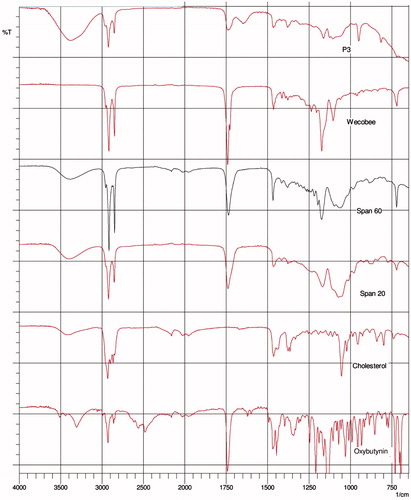
Figure 4. ATR-FTIR spectra of P4 proniosomal gel and its individual components.
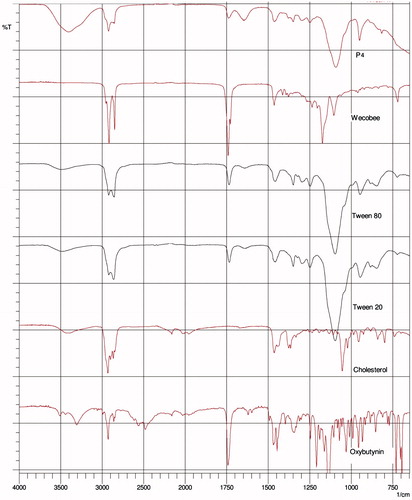
Figure 5. Percent cumulative permeation of various proniosomal formulations through mouse skin in vitro. Each plot represents the mean ± SD of 4 rats with p < 0.05.
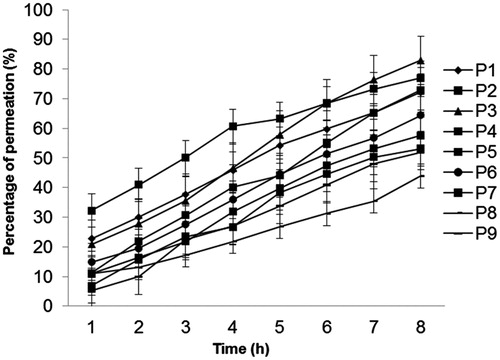
Table 4. Percent cumulative permeation and permeation rate of oxybutynin chloride proniosomes across mouse skin in vitro.
Figure 6. (A) Effect of control, oral and transdermal administration of oxybutynin chloride proniosomal gel (P3 and P4) on pilocarpine-induced salivary secretion in rats. (B) Recovery of pilocarpine-induced salivary secretion after transdermal administration of oxybutynin chloride in rats. Each column represents the mean ± SD of four rats. Statistically significant data (p < 0.05 = ***).
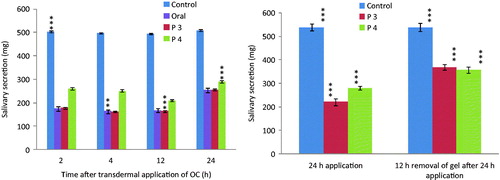
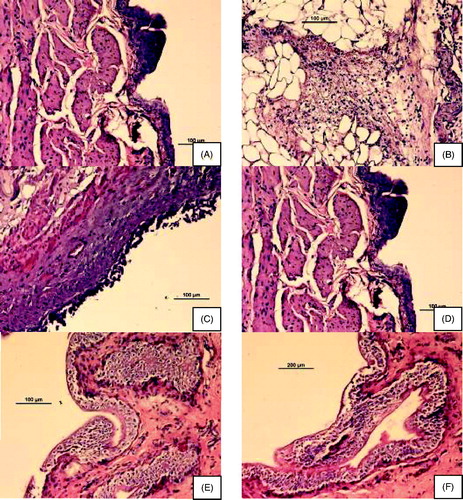
Figure 7. Histologic images of bladders in different groups of rats. (A) control; (B and C) acetic acid-induced overactive bladder; (D) oxybutynin treated (p.o.); (E) P3 gel-treated; (F) P4 gel-treated.