Figures & data
Figure 1. In vitro release profile of GA and GAL. GAL showed very minimal release of GA in 48 h.
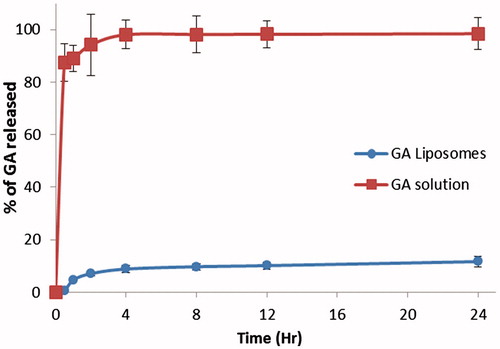
Table 1. IC50 values of MDA-MB-231, Hep G2 and MIA PaCa-2 cells treated by GA and GAL for 48 h. Data represent mean ± SD (n = 3).
Figure 2. Determination of protein expression levels by western blot. (A) Expression of bcl2, survivin, Bax, cyclin D1 and p53 in comparison to the control β-actin in GA- and GAL-treated MDA-MB-231 cells by western blot. Untreated cells were used as control. (B) Western blot analysis of expression of different proteins up/downregulated significantly in GAL treated cells. Data are calculated from triplicate experiments and presented as mean, and error bars refer to SD, *p < 0.05, **p < 0.01 compared with control.
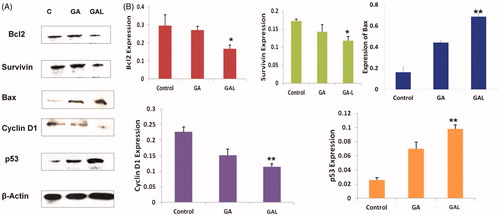
Figure 3. Quantification of microRNA-224 and microRNA-34b expression by real-time PCR. MDA-MB-231 cells were treated with GA and GAL and quantified the expression of miR-224 and miR-34b. Each experiment was performed in triplicate. The expression level of each gene was normalized by snRNA and then compared to control cells. The means of the normalized microRNA expression values were calculated for each time point and expressed as relative fold changes (mean ± SD). *p < 0.05, compared with control.
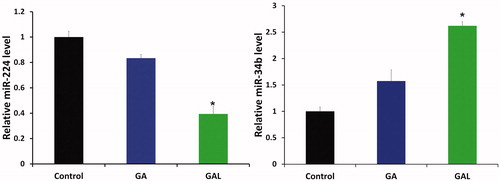
Figure 4. Effect of GA and GAL on angiogenesis by tube formation assay. HUVEC cells were treated with (A) no treatment, control (B) Docetaxel (C) GA and (D) GAL at indicated concentrations and docetaxel used as a positive control. (E) Analysis of percentage inhibition of angiogenesis by calculating branch points in GA and GAL-treated cells. Data are calculated from triplicate experiments and presented as mean, and error bars refer to SD, *p < 0.05 compared with control.
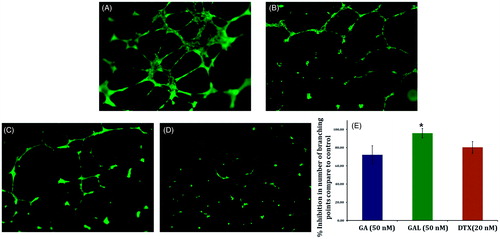
Figure 5. In vivo efficacy of GA and GAL. (A) Tumor growth kinetics with dosing every other day for five times. (B) Relative tumor weight of mice after the treatment. Data are expressed as mean ± SEM (n = 6). *p < 0.05 compared with control.
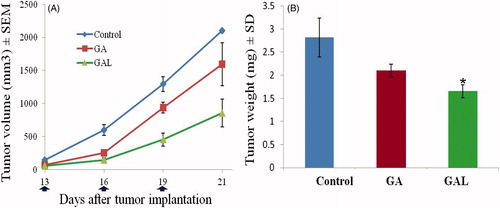
Figure 6. In vivo apoptotic activity of GA and GAL in Balb/c nu/nu mice by western blot. (A) Expression of Bcl2, survivin, Bax, cyclin D1, p53 and CD31 in comparison to the control β-actin in GA and GAL-treated tumor tissues by western blot. The untreated animal group were maintained as control. (B) Western blot analysis of expression of different proteins up/downregulated in GA-treated cells. Data are calculated from triplicate experiments and presented as mean, and error bars refer to SD, *p < 0.05, **p < 0.01 compared with control.
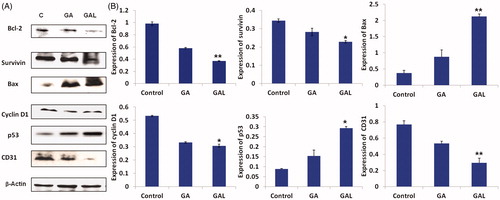
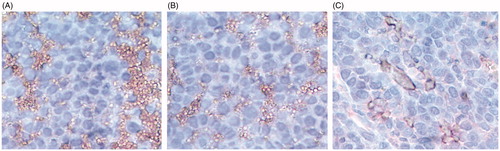
Figure 7. Analysis of CD31 expression by immunohistochemistry. Immunohistochemical peroxidase staining of CD31 in xenograft breast tumors of (A) Control, (B) GA and (C) GAL treatment groups. Presence of dark stain indicated positive staining for the primary antibody.