Figures & data
Table 1. Factors and their corresponding levels for 32 optimization technique.
Table 2. Experimental flux values (μg/cm2/h) and % EE obtained from formulations prepared of various surfactants used in 32 optimization technique after 24 h (mean ± SD; n = 3).
Figure 1. Effect of surfactants on flux value across rat skin of optimized three elastic liposomes: (A, D and G) represent 3D-contour profile, (B, E and H) represent 2D contour and (C, F and I) represent interaction curves.
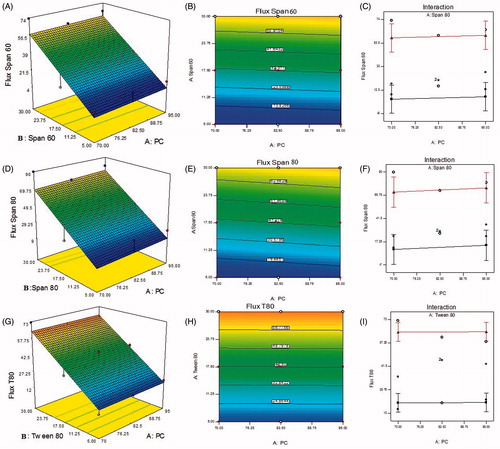
Figure 2. Effect of surfactants on % EE of optimized three elastic liposomes: (A, D and G) represent 3D-contour profile, (B, E and H) represent 2D contour and (C, F and I) represent interaction curves.
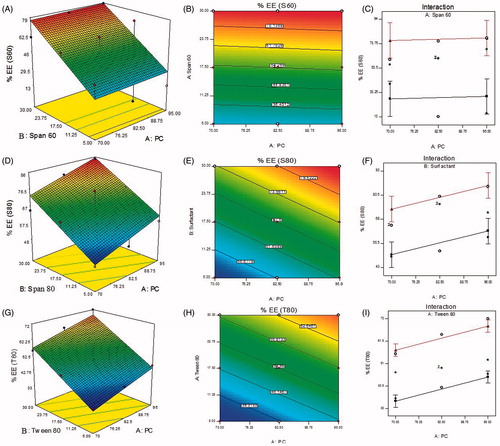
Table 3. The composition of EL3-S80-loaded gel formulations with different permeation enhancers.
Table 4. Characterizations of various developed gel formulations and evaluation of screened gels.
Figure 3. The percent cumulative amount of 5-FU permeated across rat skin (24 h).
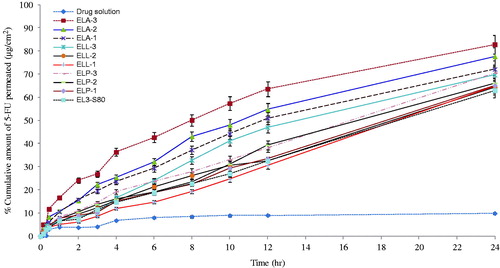
Figure 4. Drug deposited into the skin after 24 h from various formulations.
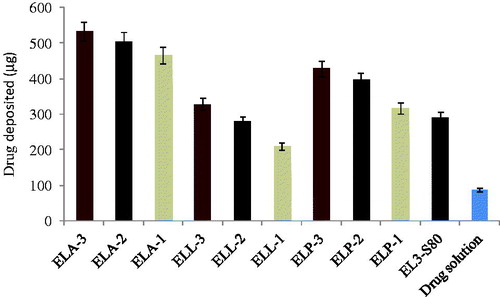
Figure 5. Arrhenius plot of formulations and drug solution permeation across the skin.
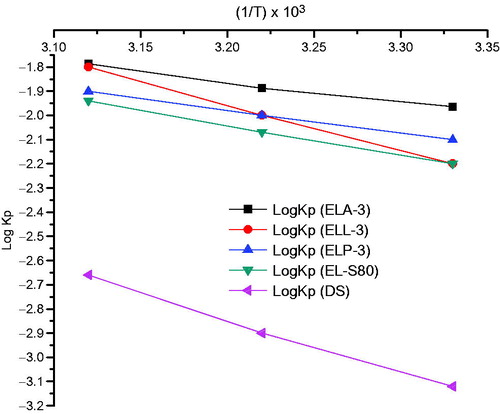
Figure 6. Representative images of Draize test on rabbit dorsal skin. (A) Untreated skin. (B) SLS. (C) Blank gel. (D) Drug solution. (E) ELA-3 gel. (F) ELA-2. (G) ELL-3. (H) ELP-3.
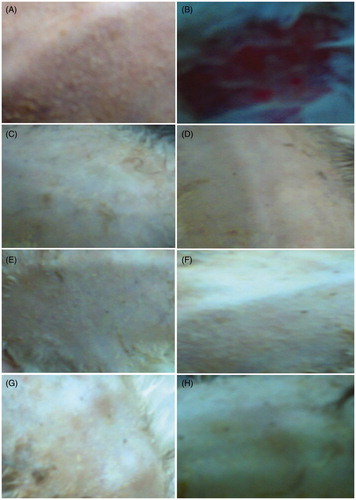
Table 5. Mean erythemal and edema scores observed at the end of 1, 24, 48 and 72 h.
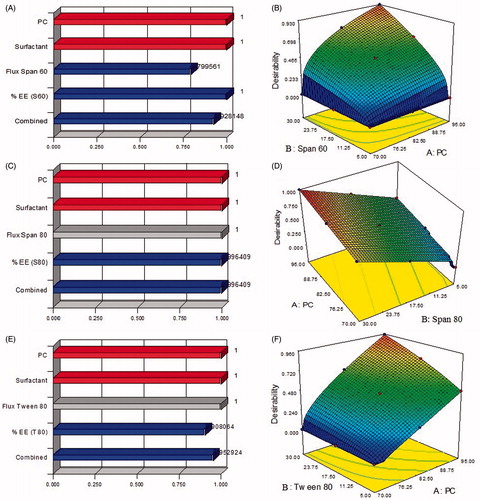
Figure 7. Desirability curve of optimized three elastic liposomes. (A) Desirability bar graph of Span 60 and PC. (B) 3D-contour profile Span 60 and PC. (C) Desirability bar graph of Span 80 and PC. (D) 3D-contour profile Span 80 and PC. (E) Desirability bar graph of Tween-80 and PC. (F) 3D-contour profile Tween-80 and PC.