Figures & data
Table 1. Qualitative and quantitative composition of the final melatonin-containing formulations.
Table 2. In vitro and in vivo efficacy tests of the PM emulsions.
Table 3. Droplet size distribution of the PM1 and PM2 emulsions (n = 625; mean ± SD) and percentage of melatonin recovered in batches 1 and 2 (mean ± SD; n = 3) stored at 25 and 40 °C during 90 days.
Figure 1. UV degradation studies of PM2 and melatonin solution (Mel Sol).
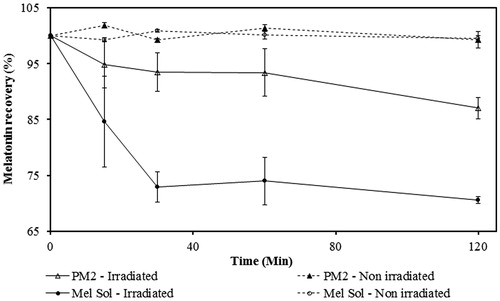
Figure 2. Permeation profile of melatonin from PM2 and Mel Solution (Sol) through newborn pig skin (mean ± SD, n = 6).
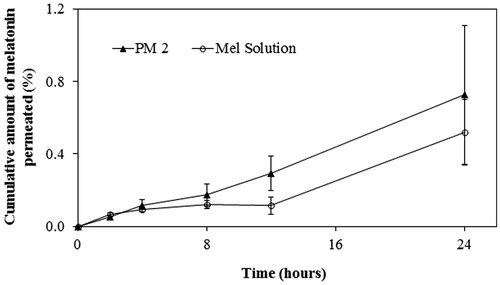
Figure 3. Penetration of PM2 and melatonin solution (Mel Sol) in the SC (from tape stripping, TS) and viable skin layers (epidermis and dermis) after 24 h. Results are expressed as mean ± SD (n = 6). Statistical analysis was performed using one-way ANOVA with Tukey’s post-hoc test (p < 0.05).
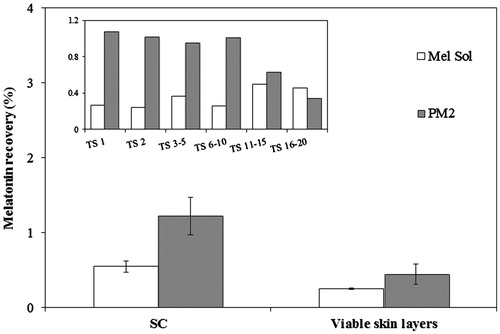
Figure 4. Relative ROS determination of HaCat cell line measured by the H2-DCFDA assay. Melatonin concentration is 1% w/w in all cases. Results are expressed as mean ± SD (n = 6). Statistical analysis was performed using one-way ANOVA with Tukey’s post-hoc test (*p < 0.05).
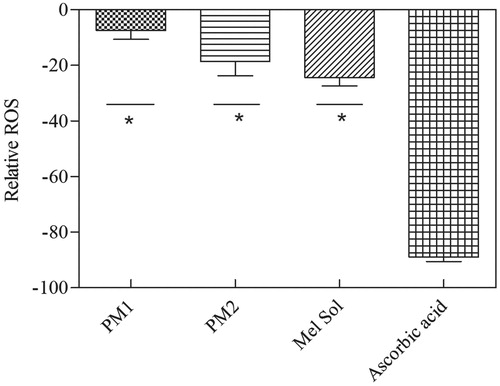
Figure 5. Levels of expression of caspase 3/7 activity in HaCat cell. Results are expressed as mean ± SD (n = 6). Statistical analysis was performed using one-way ANOVA with Tukey’s post-hoc test (*p < 0.05).
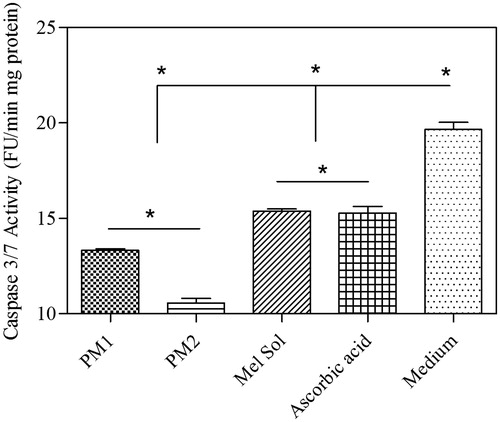
Table 4. Chemical properties of the ingredients presented in the PM formulations.
Table 5. Summary of the biological safety of the ingredients.
Table 6. Exposure data of formulation ingredients.
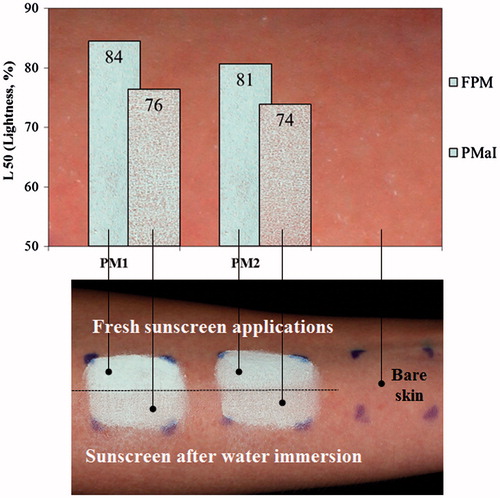
Figure 6. Skin whiteness resulting from sunscreens applied on dry skin and cross-polarized images of two sunscreens (PM1 and PM2) applied to the volar forearm of a subject. Fresh sunscreen applications with 30 min air drying (FPM) and sunscreen after 40 min water immersion (PMaI).