Figures & data
Table 1. The experimental plan of the factorial design 23 for the preparation of lacidipine proniosomes for transdermal delivery.
Table 2. The composition of lacidipine proniosomes formulations and their characterization results.
Figure 1. Optical photomicrograph of lacidipine proniosomes of F4.
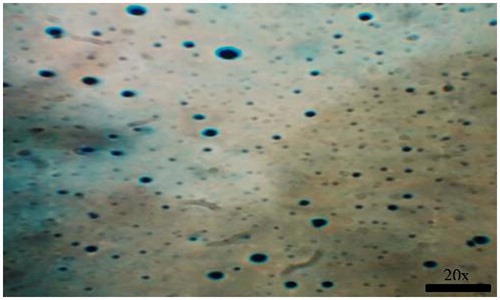
Figure 2. 3D response surface plots showing the effect of independent variables on the mean vesicle size of the prepared lacidipine proniosomes formulations (Y1).
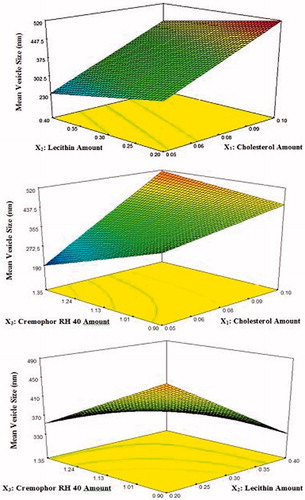
Figure 3. 3D response surface plots showing effect of independent variables on the percentage entrapment efficiency (%EE) of lacidipine in the prepared proniosomes formulations (Y2).
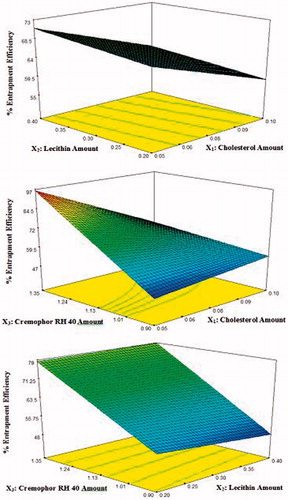
Figure 4. Release pattern of lacidipine from proniosomes formulations and from the plain drug suspension.
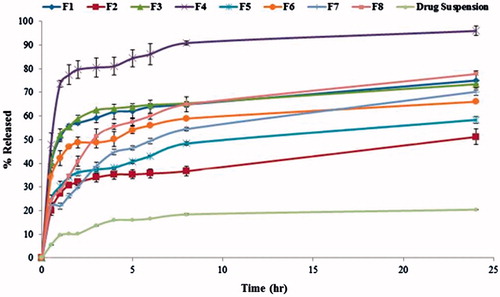
Figure 5. 3D response surface plots showing effect of independent variables on the percentage release efficiency (%RE) of lacidipine from the prepared proniosomes formulations (Y3).
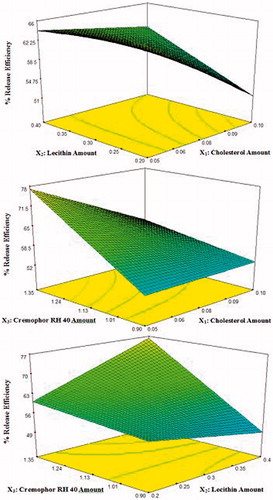
Figure 6. Permeation profile of lacidipine from optimized proniosomal gel formulation and from the control emulgel through excised rabbit skin.
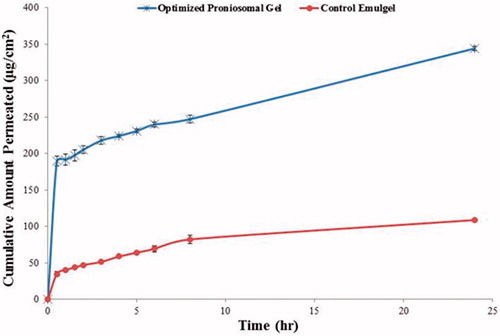
Table 3. Permeation data parameters.
Figure 7. TEM photograph of lacidipine proniosomal gel formulation.
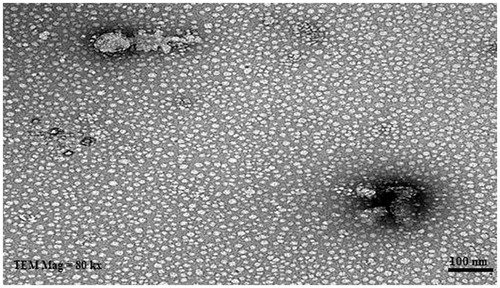
Figure 8: Mean plasma concentration time curve of lacidipine after oral administration of lacipil® tablet and after transdermal application of the proniosomal gel formulation.
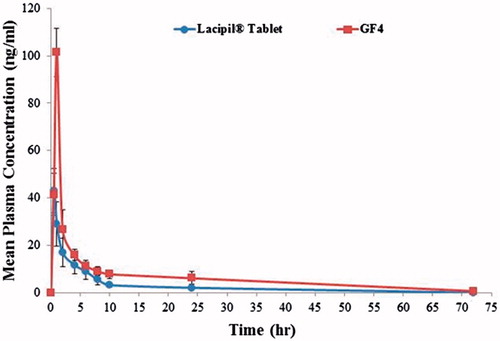
Table 4. Pharmacokinetic parameters of lacidipine following oral administration of lacipil® tablet and transdermal application of the optimized proniosomal gel formulation.
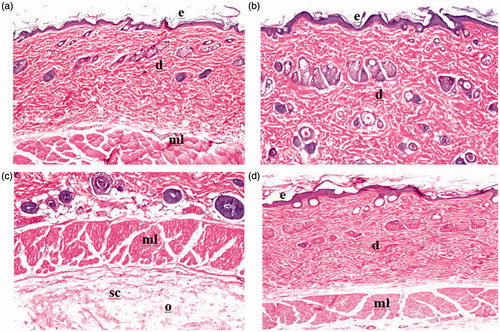
Figure 9. Light micrographs of rat skin untreated (a). Light micrographs of rat skin treated with standard irritant (b). Light micrographs of rat skin treated with standard irritant (c). Light micrographs of rat skin treated with optimized lacidipine proniosomal gel formulation (d).