Figures & data
Figure 1. Structure diagram of glycyrrhizic acid.
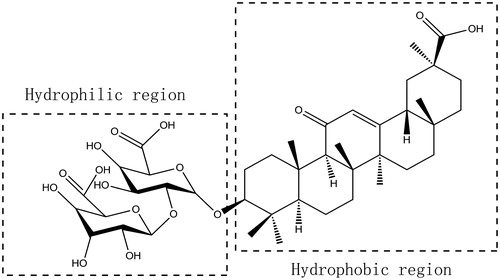
Figure 2. The HPLC graphs of POD standard (A), POD-loaded GA micelles formulation (B), the sample from the in vitro skin permeation study (C), and the sample from skin deposition study (D).
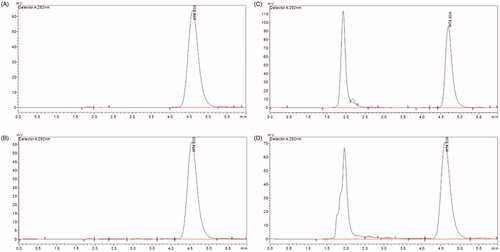
Figure 3. (A) Phase-solubility diagram of the POD solution at different ethanol–water ratios (0%, 10%, 20%, 25%, 30%, 35%, and 40%); (B) influence of the GA/POD ratios and ethanol contents (0%, 15%, 20%, 25%, and 30%) on the solubility of POD. (C) Influence of different GA/POD ratios on the encapsulation efficiency of POD as the ethanol content was set at 25% (v/v); Data are expressed as the mean ± SD (n = 3).
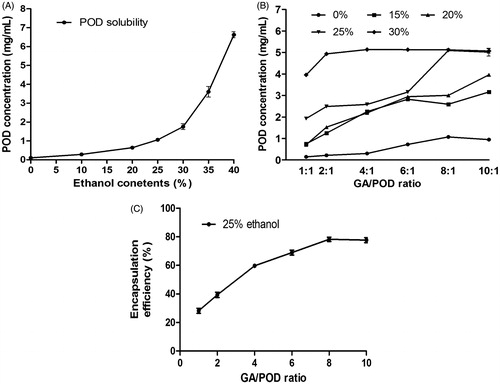
Figure 4. DSC thermograms of the pure POD, pure GA, POD, and GA physical complexes and POD-loaded GA micelles.
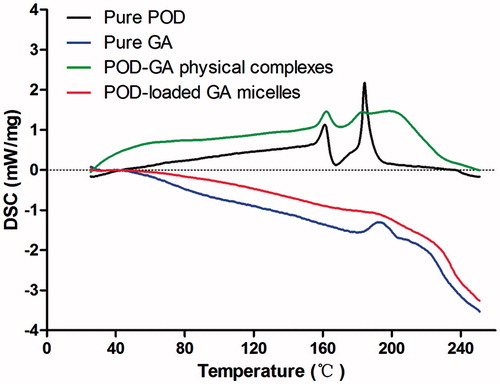
Figure 5. The CMC of GA in the ethanol–water solution in contents of zero percent (A), 15% (B), 25% (C), 35% (D), and 55% (E); Change of the CMC in different ethanol levels (F).
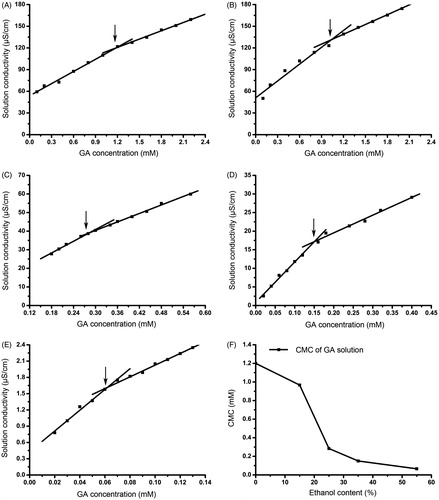
Figure 6. Dynamic light scattering results of the POD-loaded GA micelles (A) and blank micelles (B); TEM images of the POD-loaded GA micelles preparation (×20 k and ×50 k) (C).
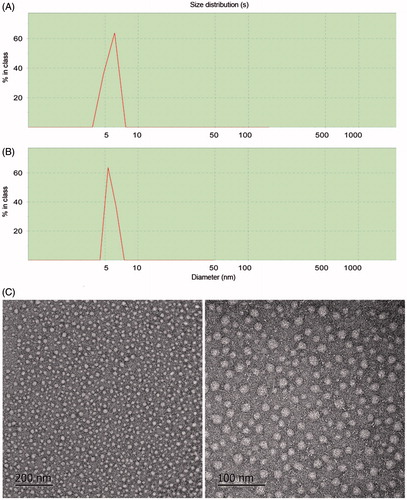
Table 1. The characteristic parameters of the POD-loaded GA micelles.
Figure 7. (A) In vitro skin permeation studies of the skin applied with POD tincture, POD-loaded GA micelles preparation, and POD tincture (included GA). The POD concentration of these samples was 5 mg/mL (n = 5); (B) In vitro release profiles of the POD-loaded GA micelles in PBS at 37 ± 0.5 °C (n = 3); (C) In vivo drug-deposition studies of the skin applied with the POD-loaded GA micelles preparation (5 mg/mL) and the POD tincture of different drug concentrations (1, 3, and 5 mg/mL); fluorescent images of the rat skin treated with the GA solution (D), POD tincture (E), and POD-loaded GA micelles preparation (F).
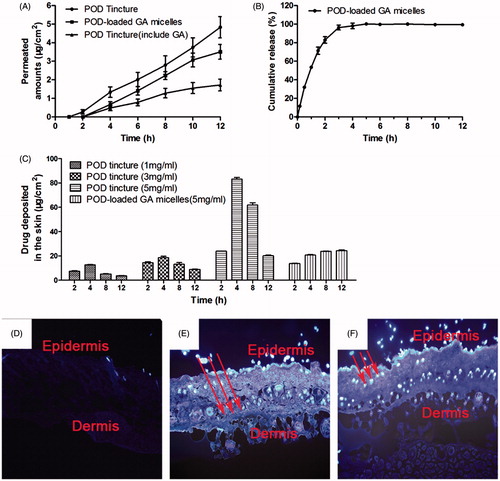
Table 2. The in vitro skin permeation study.
Table 3. The amount of drug deposited in skin (μg/cm2).
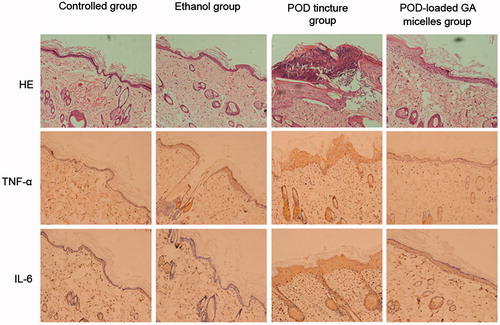
Figure 8. HE-staining graphs showing the histological changes of the skin; the immunohistochemical photograph showing the difference between the skin groups treated with physiological saline, 75% ethanol, POD tincture, and POD-loaded GA micelles formulation (magnification, ×200).