Figures & data
Figure 1. Schematic diagram of FA–SA conjugate synthesis.
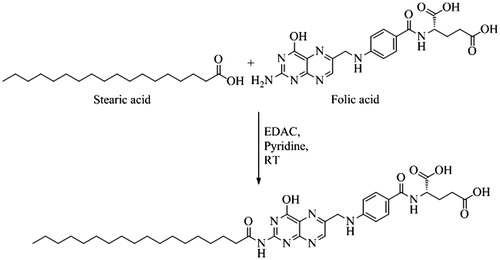
Table 1. FC-CCD design with factors with corresponding levels and responses.
Figure 2. Cytotoxicity of DTX and CRM in MDA-MB-231 cells. Results are mean ± SEM (n = 3). p value significant at ***0.01.
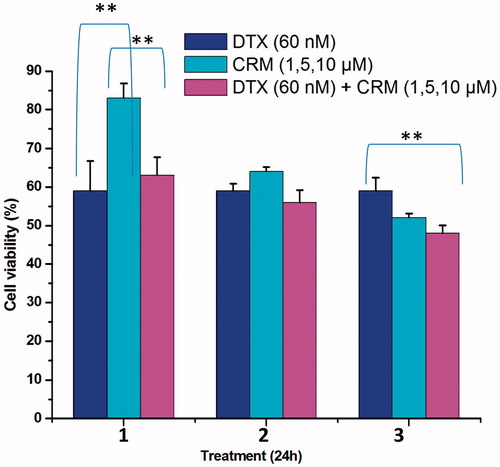
Figure 3. Solubility study of DTX (A), CRM (B) and 1:1 mixture of DTX and CRM (C) in solid lipids. Values are mean ± SD (n = 3).
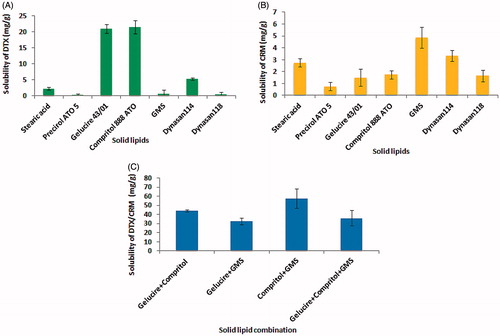
Table 2. Results of FC-CCD experiment trials.
Figure 4. TEM image of F-DC-SLN.
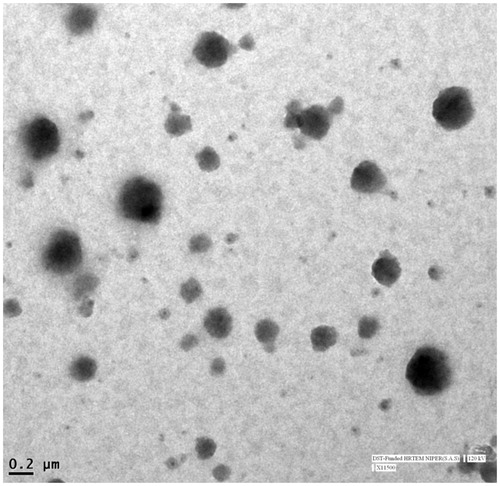
Table 3. Particle size, PDI and EE of SLN before and after freeze drying.
Figure 5. DSC characterization of SLN. (A) CRM, (B) DTX, (C) GMS, (D) Compritol, (E) blank SLN, (F) DC-SLN, (G) F-DC-SLN.
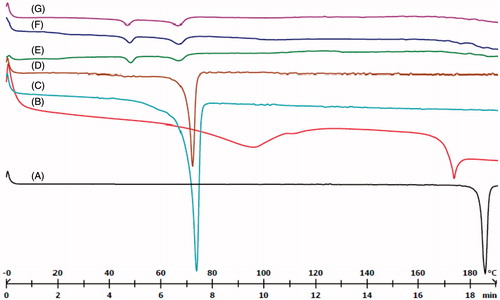
Figure 6. PXRD characterization of SLN.
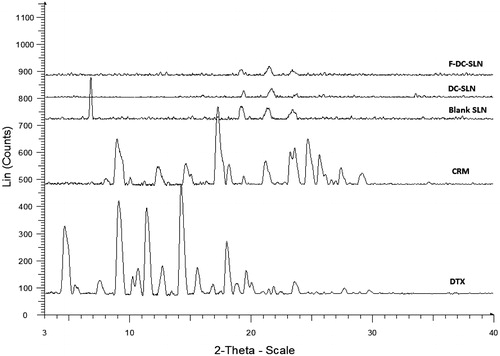
Figure 7. Polarized light microscopy image shows absence of birefringence in SLN dispersion.
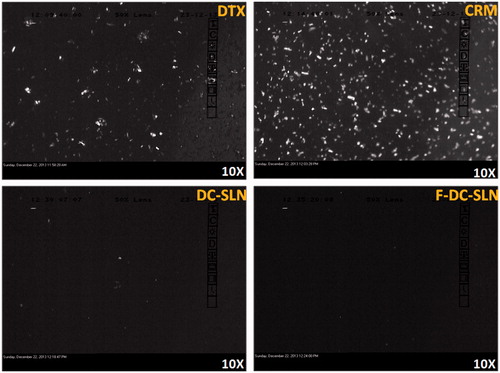
Figure 8. FTIR characterization of folic acid on surface of SLN. (A) Folic acid, (B) blank SLN, (C) DC-SLN, (D) F-DC-SLN.
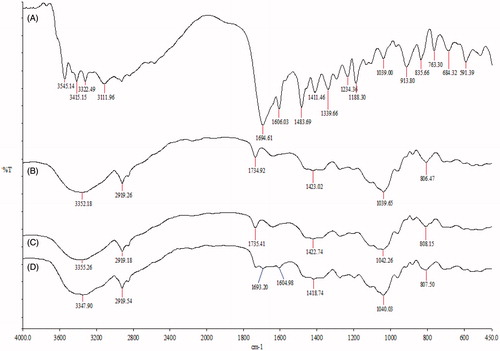
Figure 9. In vitro release of F-DC-SLN in PBS (0.01 M, pH 7.4, 50% v/v ethanol). Values are mean ± SD (n = 3).
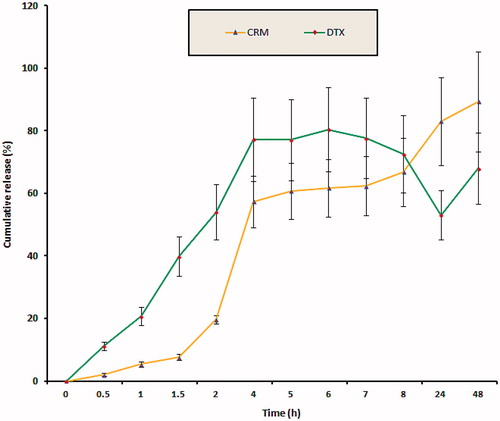
Figure 10. Cell uptake efficiency of SLN formulations. Values are mean ± SEM (n = 3). p value significant at *0.05.
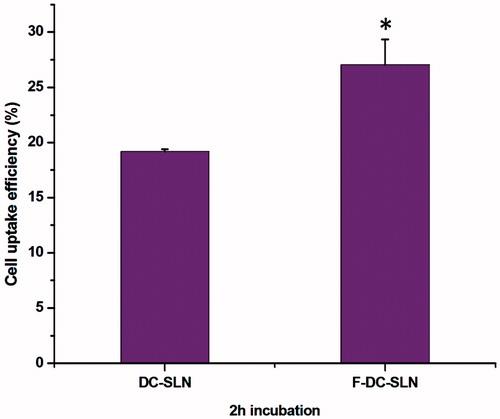
Figure 11. Fluoroscence microscope images shows internalization of free coumarin (a), DC-SLN (b) and F-DC-SLN (c) in MCF-7 cells.
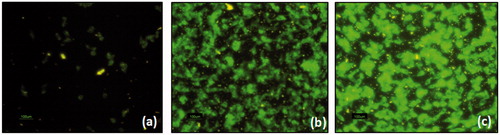
Figure 12. In vitro cytotoxicity of SLN in MCF-7 cells. Values are mean ± SEM (n = 3). p value significant at **0.01; ***0.001.
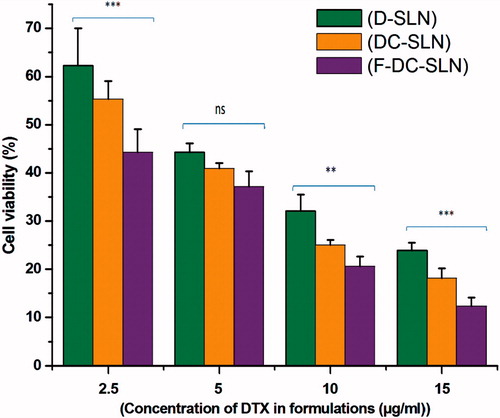
Figure 13. In vitro hemolysis test of SLN formulations. Values are mean ± SD (n = 3). p value significant at ***0.001.
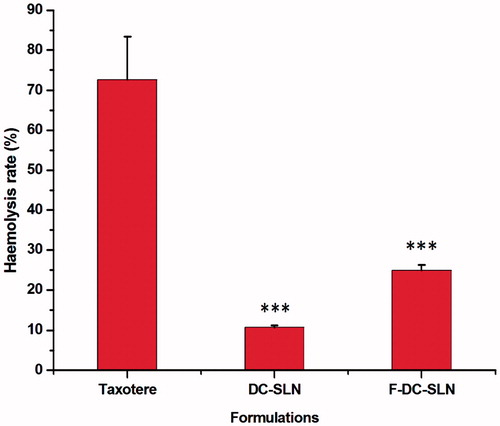
Figure 14. Plasma concentrations versus time profile of DTX after i.v. administration of DTX formulations. Values are mean ± SD (n = 5).
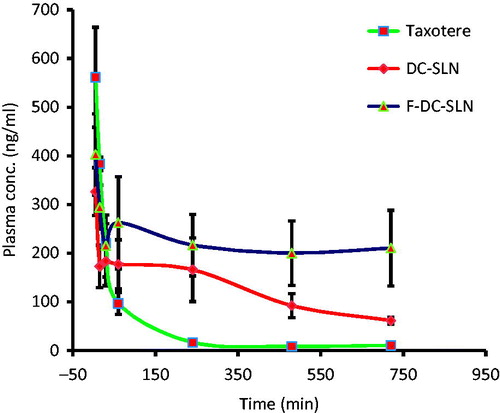
Table 4. Pharmacokinetic parameters of DTX after i.v. administration of Taxotere, DC-SLN and F-DC-SLN in rats.
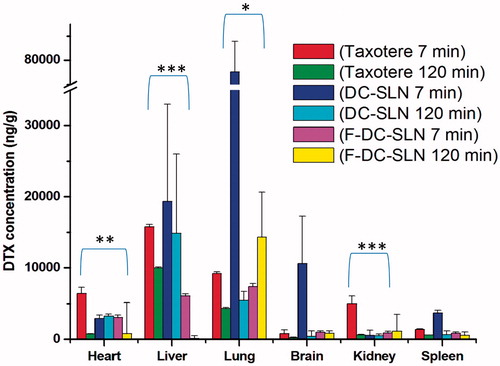
Figure 15. Biodistribution of DTX after i.v. administration of DTX formulations. Stastitical diffrence between Taxotere 7 min and F-DC-SLN 7 min is shown that values are mean ± SD (n = 6). p value significant at *0.05, **0.01 and ***0.001.