Figures & data
Figure 1. Effects of SRL/lipids (A), emulsifier/lipids (B), OA/ATO 5 (C), homogenization pressure (D), and cycles (E) on entrapment efficiency (EE), drug loading (DL), and particle size of SRL-NLCs. Significance at p < 0.05 level. (A) EE: 10/100 versus each of other three groups. DL: between each two groups. Size: either 2/100 or 3/100 versus either 4/100 or 10/100. (B) Size: between each two groups. (C) Size: between each two groups. (D) Size: either 10 000 or 20 000 psi versus 30 000 psi. (E) Size: cycle 3 versus 4.
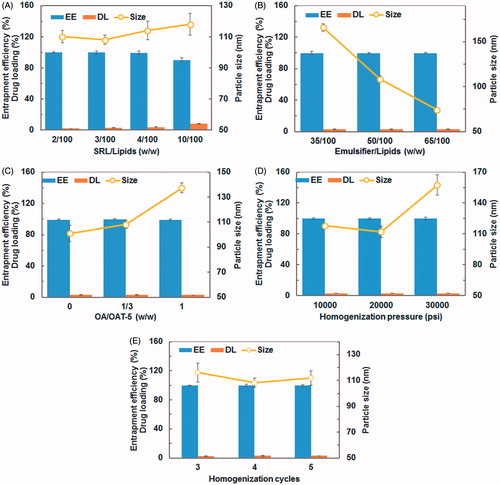
Figure 2. Intensity Gaussian distribution of SRL-NLCs particle size.
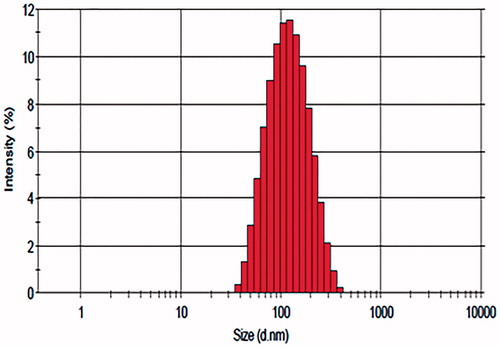
Figure 3. TEM photograph of SRL-NLCs.
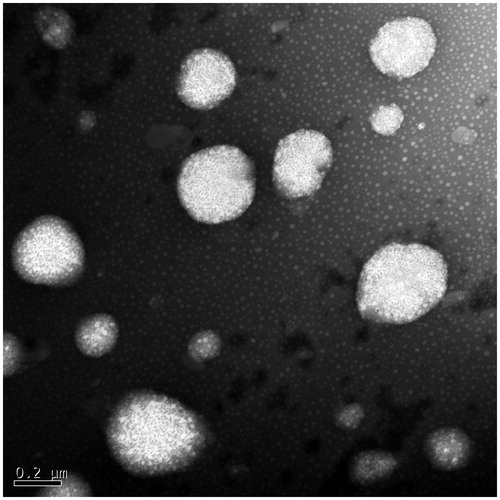
Figure 4. In vitro release profile of SRL-NLCs and commercial SRL tablets.
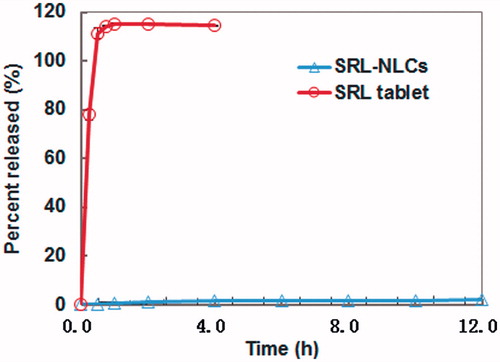
Figure 5. Cumulative lipolysis percent–time profiles of SRL-NLCs titrated by NaOH at constant pH of 7.5. Data expressed as mean ± SD (n = 3).
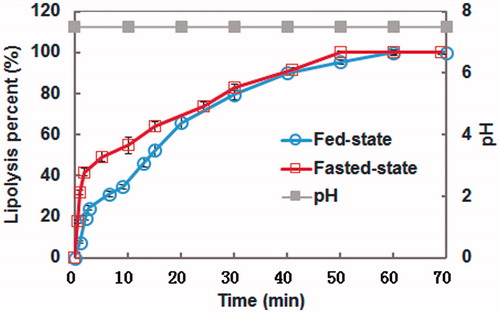
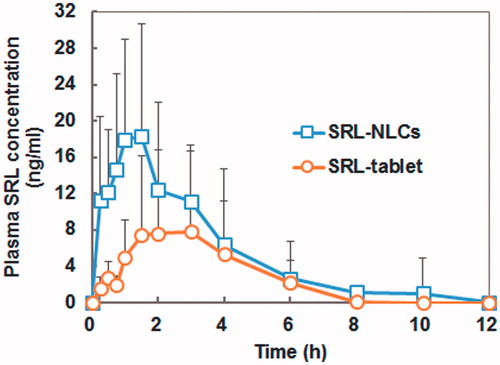
Figure 6. Blood concentration–time profiles of SRL after oral administration of optimal SRL-NLCs and commercial SRL tablets to beagle dogs (mean ± SD, n = 6).