Figures & data
Figure 1. Schematic diagram for (A) synthesis of (i) TPGS-COOH, (ii) TPGS-Tf and (B) preparation of (i) non-targeted (DTX-QD-TPGS) and (ii) transferrin receptor targeted (DTX-QD-TPGS-Tf) liposomes. DTX-QD-TPGS: Non-targeted DTX and QDs-loaded theranostic TPGS Liposomes. DTX-QD-TPGS-Tf: Transferrin receptor targeted DTX and QDs-loaded theranostic TPGS liposomes.
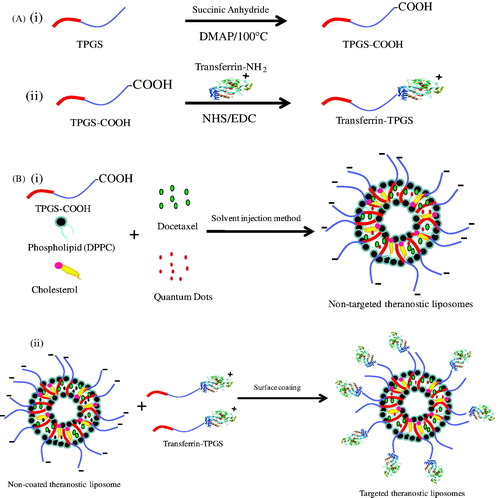
Table 1. Formulae of preparations.
Table 2. Particle size, polydispersity index, zeta potential and encapsulation efficiency.
Figure 2. Particle size results of DTX-TPGS, DTX-QD-TPGS and DTX-QD-TPGS-Tf. DTX-TPGS: Non-targeted DTX-loaded TPGS liposomes. DTX-QD-TPGS: Non-targeted DTX and QDs-loaded theranostic TPGS Liposomes. DTX-QD-TPGS-Tf: Transferrin receptor targeted DTX and QDs-loaded theranostic TPGS liposomes.
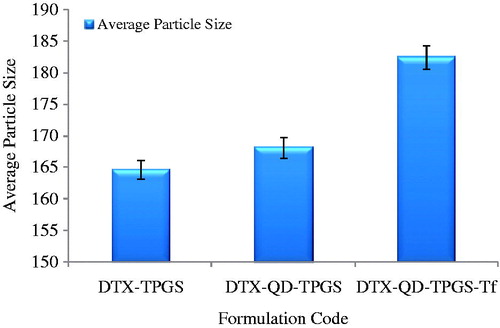
Figure 3. Histogram showing particle size and size distribution of (A) DTX-TPGS, (B) DTX-QD-TPGS, (C) DTX-QD-TPGS-Tf. DTX-TPGS: Non-targeted DTX-loaded TPGS liposomes. DTX-QD-TPGS: Non-targeted DTX and QDs-loaded theranostic TPGS liposomes. DTX-QD-TPGS-Tf: Transferrin receptor targeted DTX and QDs-loaded theranostic TPGS liposomes.
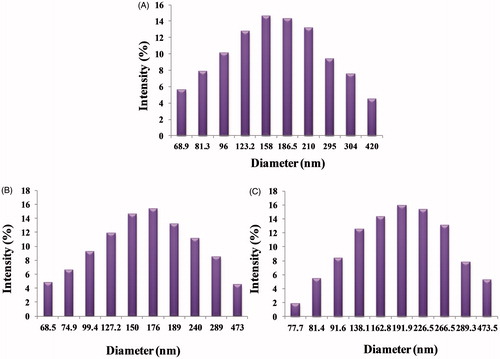
Figure 4. Transmission electron microscope (TEM) image of (A) Theranostic non-targeted liposomes (DTX-QD-TPGS) in 100 nm scale, (B) Theranostic targeted liposomes (DTX-QD-TPGS-Tf) in 100 nm. DTX-QD-TPGS: Non-targeted DTX and QDs-loaded theranostic TPGS liposomes. DTX-QD-TPGS-Tf: Transferrin receptor targeted DTX and QDs-loaded theranostic TPGS liposomes.
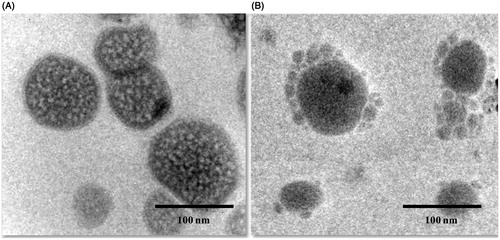
Figure 5. Atomic force microscope (AFM) image of non-targeted DTX-loaded TPGS liposomes (DTX-TPGS) (2D and 3D images).
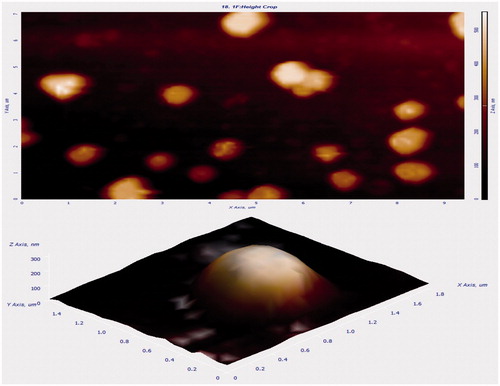
Figure 6. In-vitro drug release study of non-targeted TPGS liposomes (DTX-TPGS) and non-targetd theranostic (DTX-QD-TPGS) and targeted theranostic (DTX-QD-TPGS-Tf) TPGS liposomes in phosphate buffered saline (pH 7.4) (n = 3). DTX-TPGS: Non-targeted DTX-loaded TPGS liposomes. DTX-QD-TPGS: Non-targeted DTX and QDs-loaded theranostic TPGS liposomes. DTX-QD-TPGS-Tf: Transferrin receptor targeted DTX and QDs-loaded theranostic TPGS liposomes.
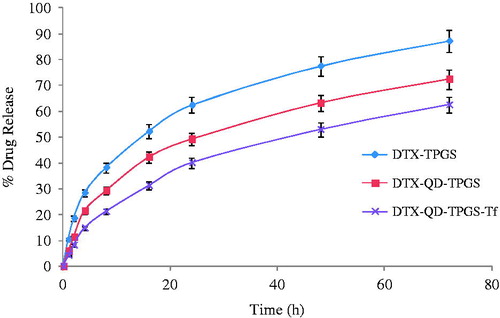
Figure 7. Brain distribution of DTX formulated in DocelTM, non-targeted theranostic TPGS (DTX-QD-TPGS) and targeted theranostic TPGS liposomes (DTX-QD-TPGS-Tf) after 0.5, 2 and 4 h of i.v. administration at the dose of 1 mg/Kg (n = 4). DTX-QD-TPGS: Non-targeted DTX and QDs-loaded theranostic TPGS liposomes. DTX-QD-TPGS-Tf: Transferrin receptor targeted DTX and QDs-loaded theranostic TPGS liposomes.
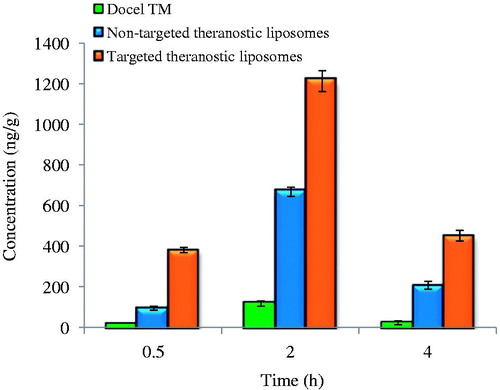
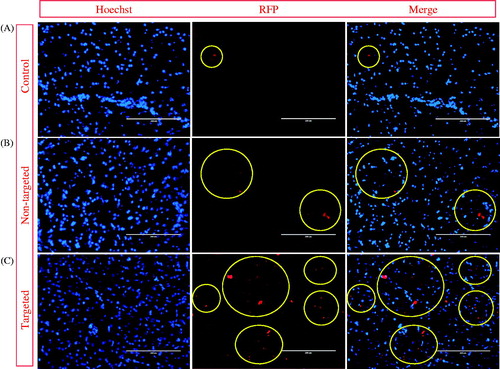
Figure 8. Fluorescence microscopic images of brain sections after 0.5 h i.v. injections of (A) free QDs (control) (from Group 4), (B) non-targeted theranostic (DTX-QD-TPGS) (from Group 8), and (C) targeted theranostic (DTX-QD-TPGS-Tf) TPGS liposomes (from Group 11). DAPI channels showing the blue fluorescence from Hoechst stained nuclei (left), QDs showing red fluorescence (middle), and Merged channels showing QDs and DAPI (right) (yellow circle is showing the presence of QDs in brain cells). Scale bar is 200 μm.