Figures & data
Figure 1. The experimental protocol of this study. After 10 mins of basal perfusion, the pre-HBOCs group hearts were perfused with 0.1 gHb/dL PolyPHb for 10 mins and KHB for another 10 mins and the control group hearts were perfused with KHB alone for 20 mins, then subjected to 35 mins of lethal ischemia at 37°C and 2 hr reperfusion. Hearts perfused with KHB for 150 mins without pretreatment and ischemia were used as sham control. KHB: Krebs-Henseleit buffer.
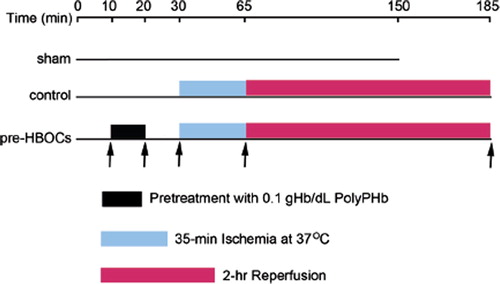
Figure 2. The LVDP (A), ±dp/dt (B and C), and LVEDP (D) of the three group hearts. Values were presented as mean ± SEM (n=8 to10). *P<0.05 and **P<0.01 vs. the sham group. †P<0.05 vs. the control group. LVDP: left ventricular development pressure, ± dp/dt: maximum LVDP increase and decrease rate, LVEDP: left ventricular end-diastolic pressure.
Figure 3. Myocardial infarct size determined by TTC staining. Red staining areas indicate viable tissue and non-stained pale areas indicate infarct tissue. Representative TTC-stained myocardial sections were shown at the top. Values were presented as mean ± SEM (n=5, 5 to 6 slices per heart). **P<0.01 vs. the sham group, ‡P<0.01 vs. the control group.
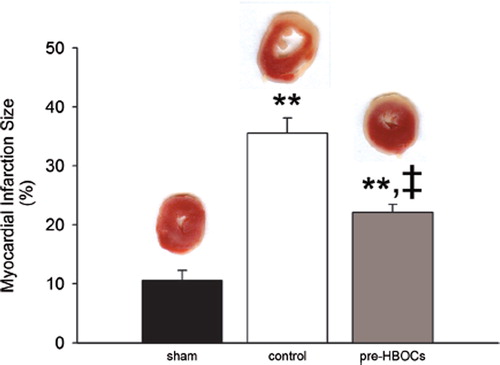
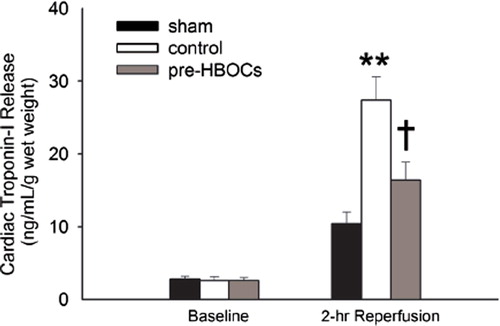
Figure 4. The cardiac troponin-I release of the three group hearts at 30-min baseline and 2-hr reperfusion. Values were expressed as mean ± SEM (n=5). **P<0.01 vs. the sham group, †P<0.05 vs. the control group.