2,591
Views
53
CrossRef citations to date
0
Altmetric
Research Article

Effect of Surfactants on the Characteristics of Fluconazole Niosomes for Enhanced Cutaneous Delivery

, , &
Pages 376-384 | Published online: 27 Sep 2011

Figures & data

Table 1. Characterization of fluconazole niosomes prepared by thin film-hydration method at 7:3:0.33 molar ratio of surfactant: CH: DCP-vesicle size (μm), polydispersity index (PI), and percent entrapment efficiency (% EE) at different time intervals after preparation and storage at 4°C; each point represents the mean ± S.D. (n = 3).

Figure 1. TEM photograph of optimized fluconazole loaded systems vesicles prepared with (A) Span 40; (B) Span 60; (C) Brij 72.
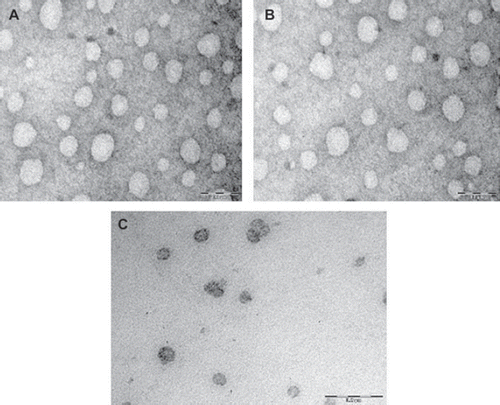
Figure 1. TEM photograph of optimized fluconazole loaded systems vesicles prepared with (A) Span 40; (B) Span 60; (C) Brij 72.

Figure 2. Stability of drug-loaded niosomes stored at 4°C for 2 months. Values are expressed as mean ± S.D. (n = 3).
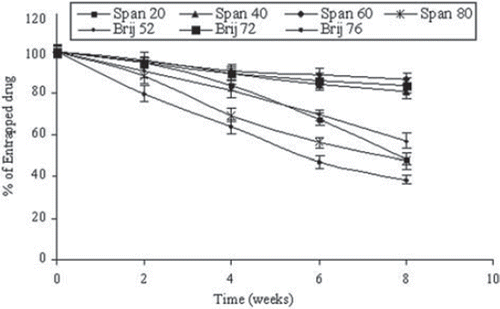
Figure 2. Stability of drug-loaded niosomes stored at 4°C for 2 months. Values are expressed as mean ± S.D. (n = 3).

Figure 3. In vitro release of fluconazole in PBS (pH 7.4) for different surfactant-based niosomal formulations. Values are expressed as mean ± S.D. (n = 3).
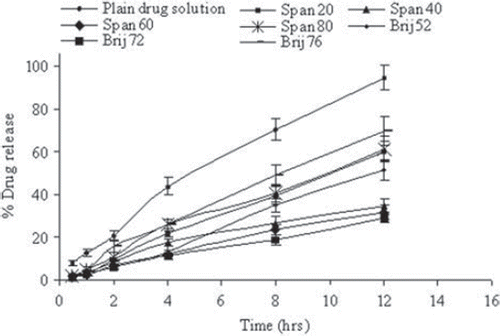
Figure 3. In vitro release of fluconazole in PBS (pH 7.4) for different surfactant-based niosomal formulations. Values are expressed as mean ± S.D. (n = 3).

Figure 4. In vitro skin permeation of drug for different niosomal formulations. Values are expressed as mean ± S.D. (n = 3).
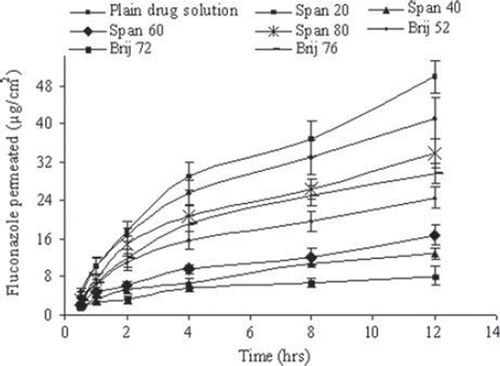
Figure 4. In vitro skin permeation of drug for different niosomal formulations. Values are expressed as mean ± S.D. (n = 3).

Table 2. Results of in vitro permeation and skin retention study from different fluconazole niosomal formulations: amount permeated through the skin at 12 hr, percent fluconazole accumulated into the skin at the end of the permeation experiments (12 hr), and Locally Accumulation Efficiency (LAC) value; drug accumulated into SC/Drug permeated through the skin ratio; the data were expressed as percent dose applied per unit area; each point represents the mean ± S.D. (n = 3).
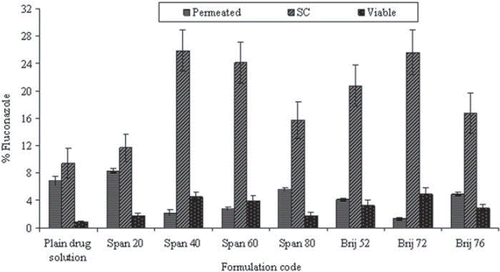
Figure 5. Percent fluconazole for different niosomal formulations for in vitro permeation and skin retention studies as mean ± S.D. (n = 3).

Figure 5. Percent fluconazole for different niosomal formulations for in vitro permeation and skin retention studies as mean ± S.D. (n = 3).

Reprints and Corporate Permissions

Please note: Selecting permissions does not provide access to the full text of the article, please see our help page How do I view content?

To request a reprint or corporate permissions for this article, please click on the relevant link below:

Academic Permissions

Please note: Selecting permissions does not provide access to the full text of the article, please see our help page How do I view content?

Obtain permissions instantly via Rightslink by clicking on the button below:

If you are unable to obtain permissions via Rightslink, please complete and submit this Permissions form. For more information, please visit our Permissions help page.