Figures & data
Figure 1. Schematic representation of the in vitro gut bacterial adhesion model using a continuous flow bioreactor packed with mucin–alginate beads. Mucin–alginate beads were composed of 2% (w/v) low-viscosity sodium alginate and 3% (w/v) mucin from porcine stomach. Beads were prepared by ionotropic gelation method. Beads were coated for 24 h with 1% (v/v) bacterial inoculum suspended in culture media, stirred at 50 rpm and incubated 24 h at 37°C in 5% CO2. Bacteria-coated beads were transferred to a glass column bioreactor under sterile conditions. Culture media was circulated throughout the system at a flowrate of 0.5 mL/min using a peristaltic pump. The whole system was incubated at 37oC.
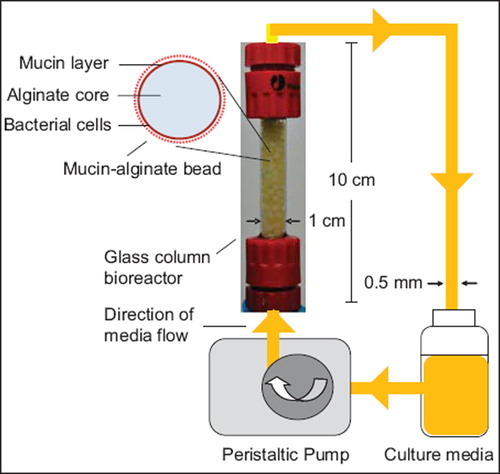
Table 1. Composition of the nutrient rich culture media circulating through the gut bacterial adhesion model.
Table 2. Comparison of the adhesion of simulated human gut Enterococci, Bifidobacteria, Lactobacilli and Clostridia in the gut bacterial adhesion model to available human colon data. On time 0, the gut bacterial adhesion model was packed with beads coated with simulated human gut microbiota. The model was incubated at 37 °C. Bacterial cell adhesion was determined using plate counting and expressed as log (CFU/cm2). All experiments were conducted in triplicates. Values are expressed as means ± SEM. Clinical data are presented as the range of the average composition of the human gut microbiota (Orrhage & Nord, Citation2000). There was not effect of time on bacterial cell adhesion of Enterococci, Bifidobacteria, Lactobacilli and Clostridia (p > 0.05).
Figure 2. Schematic representation of the anatomy of the gut lining. The gut lining is composed of a series of layer. The innermost layer consists of the muscularis mucosae. It is separated from the epithelial layer by a supportive tissue: the lamina propria. Epithelial cells are covered by the glycocalyx and a mucus viscoelastic gel layer composed mainly of mucin glycoproteins. Bacterial cells cover the mucus layer and form a complex microbial ecosystem interacting with its environment: the mucosal associated gut microbiota.
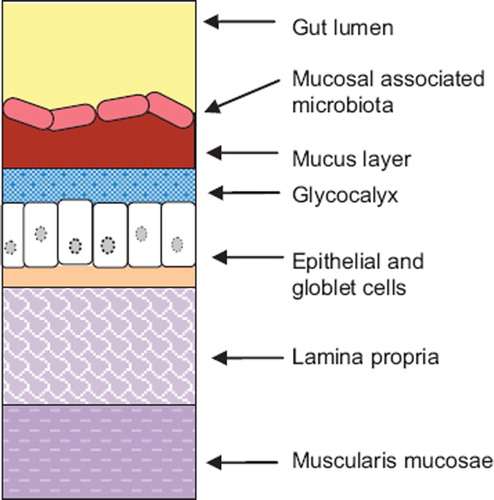
Figure 3. Effect of glass, polystyrene, alginate and mucin–alginate packing material on bacterial cell adhesion of L. fermentum NCIMB 5221. (A) L. fermentum NCIMB 5221 cell adhesion on glass, polystyrene, alginate and mucin–alginate packing material was measured by plate counting (log (CFU/cm2)). (B-D) Live/dead fluorescence assay images of L. fermentum NCIMB 5221 on (B) glass, (C) polystyrene, (D) alginate and (E) mucin–alginate packing materials. Viable cells fluoresced green (as indicated with an arrow). Original magnification was 600X. A 1% (v/v) bacterial inoculum of L. fermentum NCIMB 5221 was added to, respectively, glass, polystyrene, alginate and mucin–alginate beads suspended in MRS broth supplemented with 0.2 M CaCl2. Beads in solution were incubated 24 h at 37°C in 5% CO2 and stirred at 50 rpm. All experiments were conducted in triplicates. Values are expressed as means ± SEM. *Indicates statistical significance (p < 0.05).
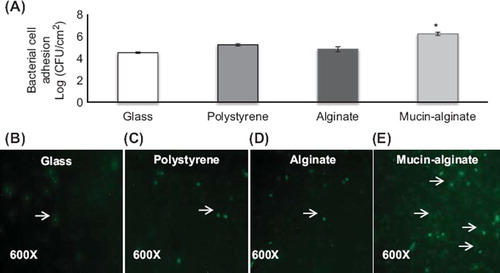
Figure 4. Bacterial cell adhesion and BSH-activity of L. reuteri NCIMB 701359 (BSH-active) and L. fermentum NCIMB 5221 (nonactive BSH) coated on mucin–alginate beads packed in the gut bacterial adhesion model. (A) Bacterial cell adhesion was determined using plate counting and expressed as log (CFU/cm2). (B) BSH-activity was determined using spectrophotometry and expressed as the rate of glycine release per CFU (µmol/h/CFU 3 106). On day 0, the gut bacterial adhesion model was packed with mucin–alginate beads coated with, respectively, L. reuteri NCIMB 701359 and L. fermentum NCIMB 5221 in distinct studies. The model was incubated at 37°C. Culture media was replaced daily. All experiments were conducted in triplicates. Values are expressed as means ± SEM. *Indicates statistical (p < 0.05).
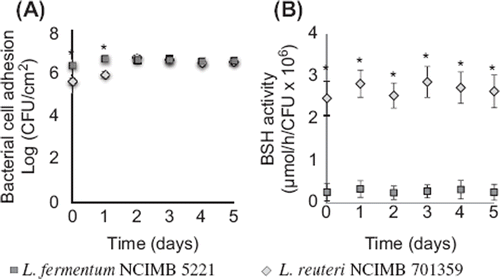
Figure 5. Effect of daily administration of L. reuteri NCIMB 701359 on bacterial cell adhesion in a gut bacterial adhesion model packed with mucin–alginate beads coated with E. coli ATCC 8739. (A) Bacterial cell adhesion was determined using plate counting and expressed as log (CFU/cm2). (B-C) Scanning electron microscope (SEM) images of mucin–alginate beads coated with E. coli ATCC 8739: (B) Control after 1 day incubation and (C) 1 day incubation after administration of L. reuteri NCIMB 701359. On time 0, the model was packed with mucin–alginate beads coated with E. coli ATCC 8739. Culture media was inoculated daily with a 1% (v/v) inoculum of L. reuteri NCIMB 701359. The model was incubated at 37°C. In the control, there was no administration of L. reuteri NCIMB 701359. All experiments were conducted in triplicates. Values are expressed as means ± SEM. *Indicates statistical significance (p < 0.05).
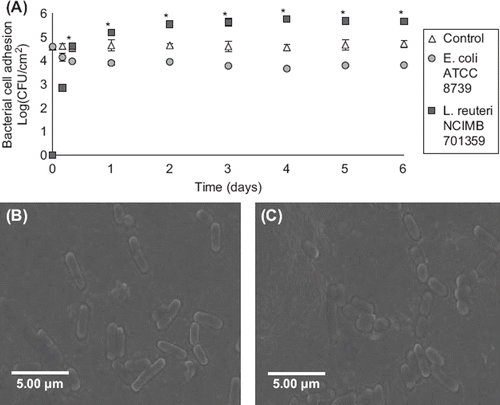
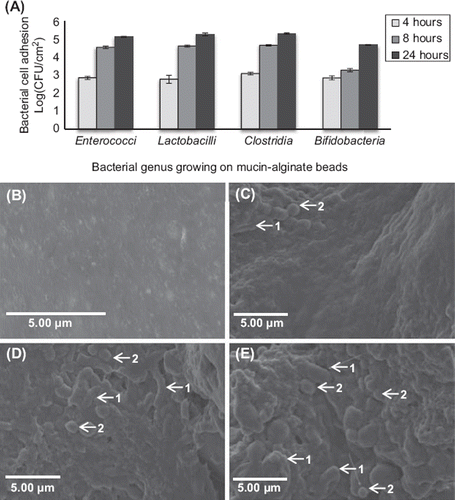
Figure 6. Effect of coating duration on the adhesion of simulated human gut microbiota on mucin–alginate beads. (A) Bacterial cell adhesion during the bead coating process was determined using plate counting and expressed as log (CFU.cm‐ 2). (B-E) Scanning electron microscope (SEM) images of mucin–alginate beads coated with simulated human gut microbiata after: (B) 0 hour, (C) 4 hour, (D) 8 hour and (E) 24 hour incubation. Elongated-shaped bacilli are labeled 1 and rounded-shaped cocci are labeled 2. On time 0, mucin–alginate beads were coated with a 1% (v/v) bacterial inoculum of simulated human gut microbiota. All experiments were conducted in triplicates. Values are expressed as means ± SEM.