Figures & data
Table 1. Number of Total and Participating Group Homes for Eight Organisations.
Table 2. Descriptions and Score Interpretations of the Group Home Culture Scale.
Table 3. Interrater Agreement and Reliability Indices for the Group Home Culture Scale (N = 58 Staff Teams).
Table 4. Descriptive Statistics for the Group Home Culture Scale (N = 58 Group Homes).
Table 5. Group Home Culture Scale Scores for Eight Organisations (N = 58 Group Homes).
Figure 1. Supporting Well-Being scores for 58 group homes across 8 organisations.
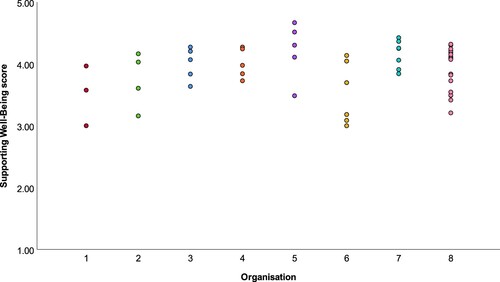
Figure 2. Factional scores for 58 group homes across 8 organisations.
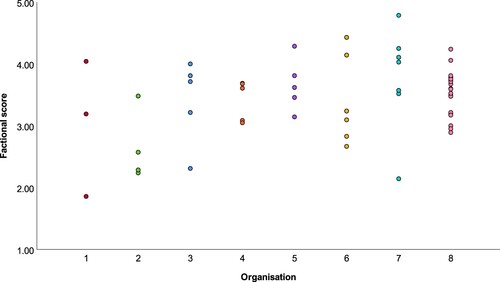
Figure 3. Effective Team Leadership scores for 58 group homes across 8 organisations.
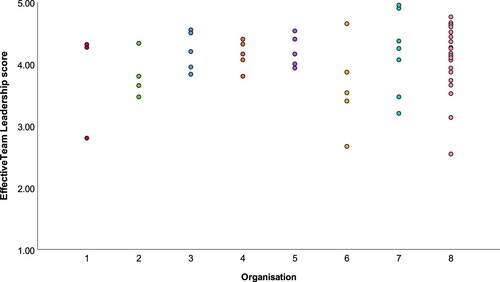
Figure 4. Collaboration within the Organisation scores for 58 group homes across 8 organisations.
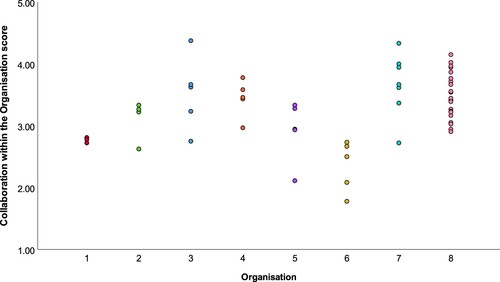
Figure 5. Social Distance from Residents scores for 58 group homes across 8 organisations.
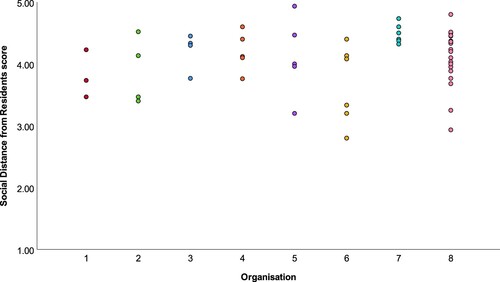
Figure 6. Valuing Residents and Relationships scores for 58 group homes across 8 organisations.
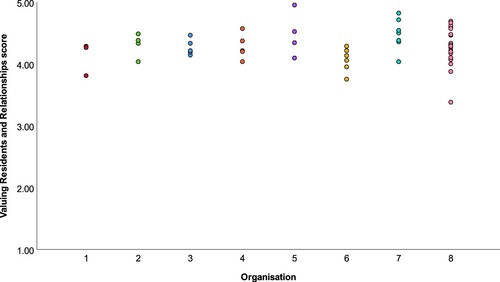
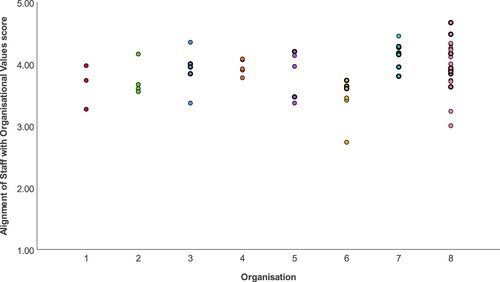
Figure 7. Alignment of Staff with Organisational Values scores for 58 group homes across 8 organisations.