Figures & data
Figure 1. Design of the experimental study. The effects of rat-PTH treatment, at daily doses of 4 μg/kg, were studied in female and male rats under two different conditions. In prevention experiment (study A) recently ovariectomised or orchidectomised rats were treated with PTH for 2.5months (groups OVX/ORX + PTH). These rats were sacrificed at 11 months old with their paired SHAMF/SHAMM and OVX/ORX groups. In intervention experiment (study B) rats that were ovariectomised or orchidectomised 6 months before, and were treated with PTH for 2.5 months (groups OVX2/ORX 2 + PTH). In study B, groups of 15-month-old rats SHAMF1/SHAMM 1 and OVX1/ORX1 were sacrificed as baseline groups for the final 18.5-month-old rat groups SHAMF2/SHAMM2 and OVX2/ORX2.
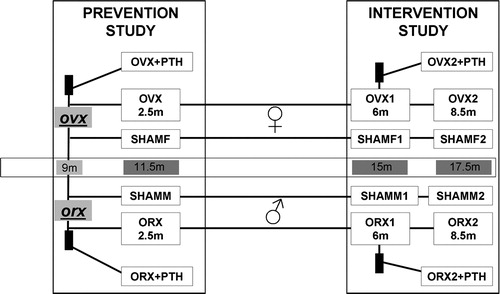
Figure 2. Examples of 1 bit black/white threshold images used for bone histomorphometry. Original digital images were obtained from 2.5 μm-thick sections of lumbar vertebra (L4) stained with von Kossa by using an optical scanner at 9600pp resolution (pixel size = 2.6 μm).
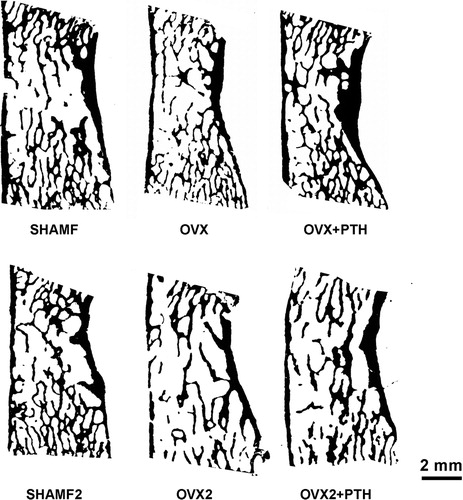
Table I. Biochemical markers of bone turnover.
Table II. Bone mineral density (BMD) (g/cm2) measured in femur (FBMD) and in lumbar vertebra (LBMD).
Table III. Bone histomorphometry of lumbar vertebra (L4) and tibia.
Figure 3. Tibial metaphysis from female rats. Representative anorganic sections from female rats in prevention (a–c) and intervention experiments (d–h). Note that in OVX groups (b,d,e) there is trabecular bone loss in the central zone. Detail of the trabecular microarchitecture (i–m) as viewed by stereoscopic zoom microscopy. Note in OVX2 (l) the extreme trabecular thinning.
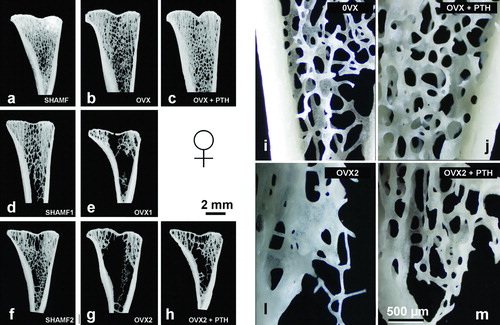
Figure 4. Tibia cortical bone from female rats. Periosteal and endosteal surfaces as view in 100 μm thick ground sections stained with toluidine blue from prevention (a–f) and intervention experiments (g–l). Note that in prevention study PTH-treatment has a dual effect as new bone formation at periosteal envelope (c) and resorption at endosteal surface (f). On the contrary, in intervention experiment, PTH-treatment produces new bone both in periosteal (i) and endosteal (l) surfaces.
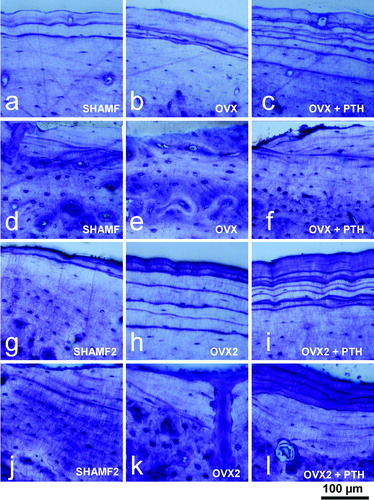
Figure 5. Tibia metaphysis from male rats. Representative anorganic sections from male rats in prevention (a–c) and intervention experiments (d–h). Note that in ORX groups (b,d,e) there is a progressive bone loss with time, and that in ORX2 group only lateral trabeculas remained. Detail of the microarchitecture of the metaphysis (i–m) as viewed by stereoscopic zoom microscopy. Note that the trabecular thinning in ORX2 (l), and in ORX2 + PTH (m) have a similar thickness to baseline ORX1 (h).
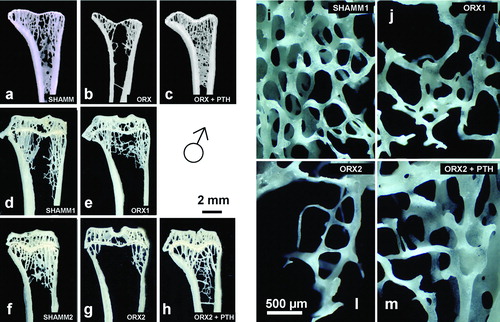
Figure 6. Lumbar vertebra from male rats. Early bone formation surfaces with cuboidal osteoblasts and osteoid seams (a,c,e) and late bone formation surfaces with elongated osteoblasts and osteoid seams (b,d,f) as shown in 2.5 μm sections stained with toluidine blue. Note that ORX group has wide osteoid seams throughout, but PTH treatment reverses impaired mineralisation.
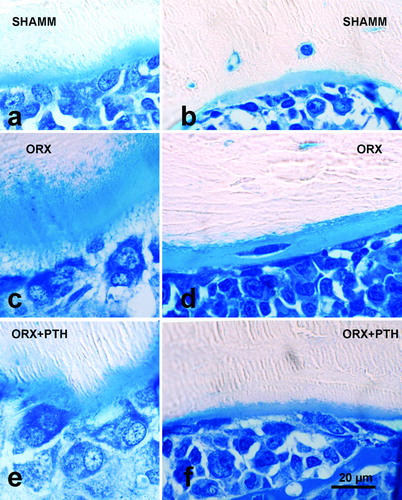
Figure 7. Tibia cortical bone from male rats. Endosteal surfaces in male rats as viewed in 100 μm-thick ground sections stained with toluidine blue from preventive experiment (a–c) and from intervention experiment (d–f). Note that ORX1 cortical bone has a wide osteoid seam in an intracortical (remodelled) osteon (e), and that PTH treatment produces new bone formation both in prevention (c) and intervention experiments (f).
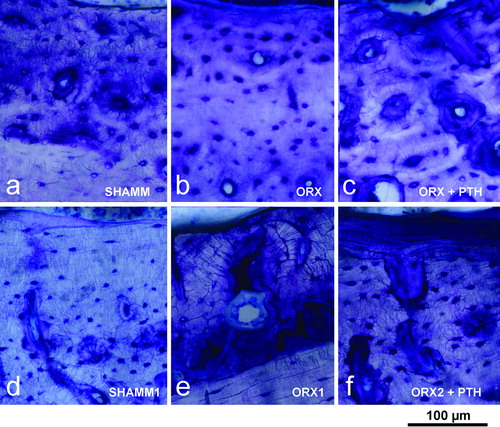
Figure 8. Mineral content profiles from females (a) and males (b). Both OVX2 and ORX2 had shifted curves to the left with respect to their SHAMF2 and SHAMM2 controls. With PTH treatment, curves are also left-shifted but broader indicating that new bone formation has occurred.
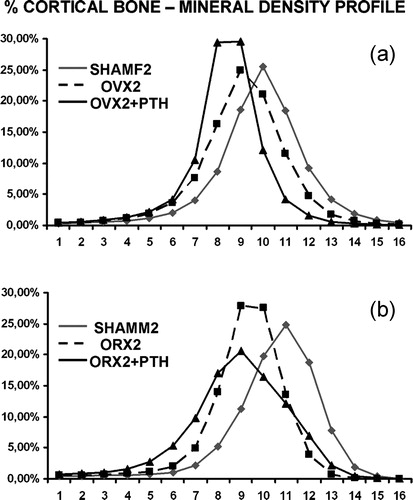
Figure 9. Colour-coded mineralisation maps from SHAMM2 (a), ORX2 (b), and ORX2 + PTH (c) obtained by BSI at ×60 magnification (pixel size = 5.6 μm). In the scale, blue colour indicates less mineralised bone, i.e., sites of new bone formation. Detail of new formation at endosteal (d) and periosteal (e) surfaces viewed at ×1000 magnification.
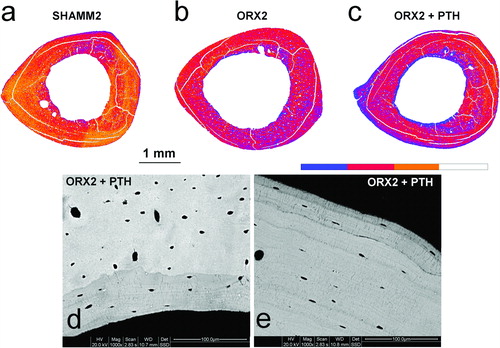
Table IV. Bone biomechanics measured in femurs.