Figures & data
Figure 1. Flow chart of the disposition of patients.
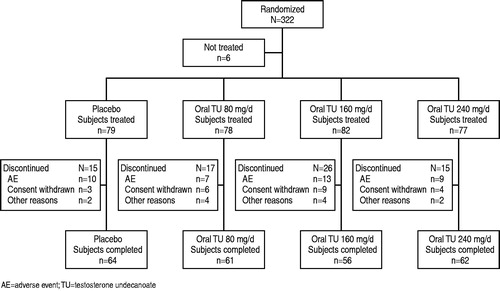
Figure 2. Effect of oral TU on osteocalcin and type I collagen C-telopeptide (mean percent change from baseline in the intention to treat group).
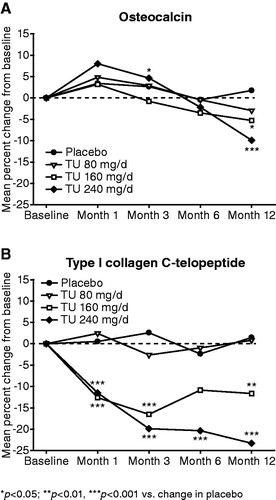
Figure 3. Effect of oral TU on BMD at the lumbar spine (L1–L4) and total hip at Month 12 (mean percent change from baseline in the intention to treat group).
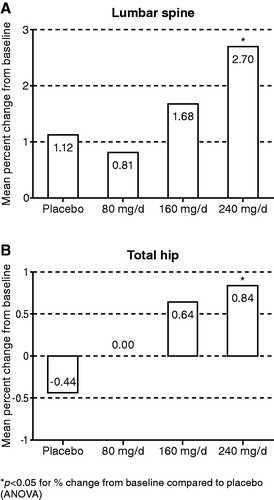
Table 1. Effects of oral TU and placebo on BMD (g/cm3) after 12 months of treatment (ITT-group, LOCF approach).
Figure 4. Effect of oral TU on LBM and BFM (mean change from baseline in the intention to treat group).
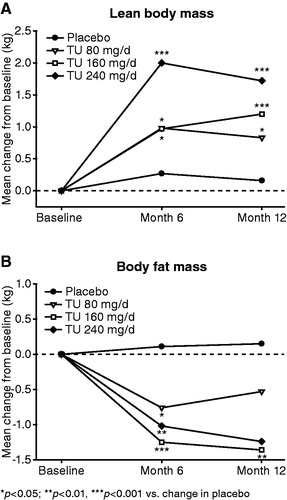
Table 2. Effects of oral TU and placebo on body composition after 12 months of treatment (ITT group, LOCF approach).