Figures & data
Figure 1. Recruitment process of the study.
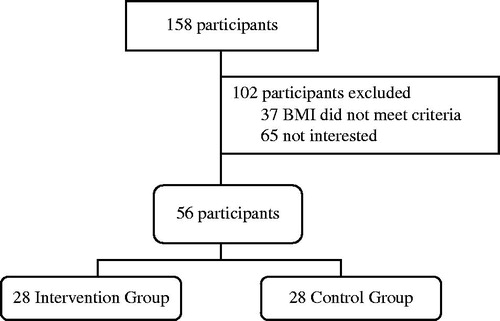
Table 1. Baseline characteristics of the subject.
Table 2. Changes in energy and macronutrient intake.
Table 3. Changes in body composition.
Table 4. Changes in blood pressure and fasting blood glucose.
Table 5. Changes in lipid profile.
Figure 2. (a) Total number of DNA rejoining cells as sum of grade 0 + 1 cells. The number of rejoining cells was increased significantly in FCR group (p < 0.001). No significant change was observed in the control group. (b) Total number of DNA damaged cells as sum of grade 2 + 3 + 4 cells. The number of damaged cells was decreased significantly in FCR group (p < 0.001). No significant change was observed in control group. (c) Total DNA damage, calculated using arbitrary unit. DNA damage was reduced significantly at week 6 (p < 0.01) and remained significant at week 12 (p < 0.001). Total DNA damage was also found decreased significantly in the control group (p < 0.05). Data expressed as mean ± SEM. Statistical test used was Wilcoxon Signed Rank Test. Significant level at *p < 0.05, **p < 0.01.
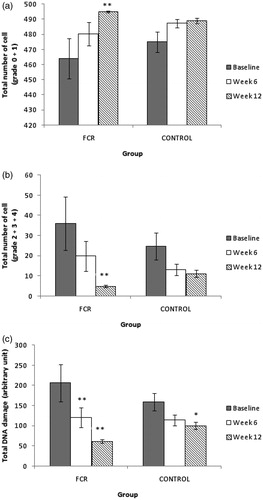
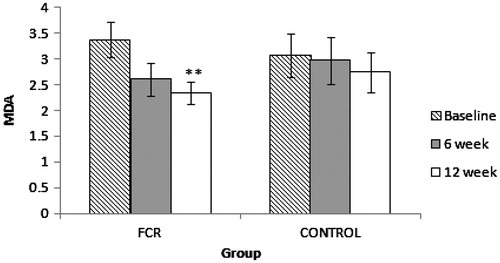
Figure 3. Malondialdehyde (MDA) as measured with HPLC. MDA was reduced significantly (p < 0.01) after three months of the study in FCR group. Data expressed as mean ± SEM. Statistical test used was Wilcoxon Signed Rank Test. Significant level at **p < 0.01.