Figures & data
Figure 1. Cell proliferation rate in LNCaP, PC3 and PNT1A cells treated by AMSCs Conditioned Media. Cell proliferation in LNCaP (A), PC3 (B) and PNT1A (C) cells treated by unconditioned DMEM, Day 3 or 1 week AMSCs Conditioned Media was determined by MTT assay at time 0, 24, 48 and 72 h of culture. Statistical significance has been considered as p < 0.05 (*).
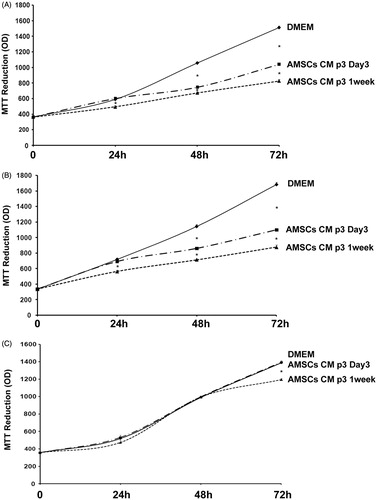
Figure 2. Cell proliferation in LNCaP, PC3 and PNT1A cells treated by AMSCs Conditioned Media as assessed by direct cell count and Trypan Blue exclusion. LNCaP (A), PC3 (B) and PNT1A (C) cell number where treated by unconditioned DMEM, Day 3 or 1 week AMSCs Conditioned Media at time 0, 24, 48 and 72 h of culture. Statistical significance has been considered as p < 0.05 (*).
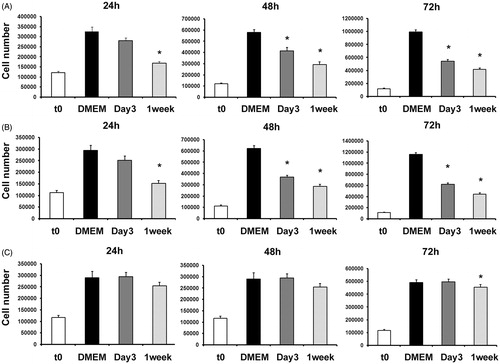
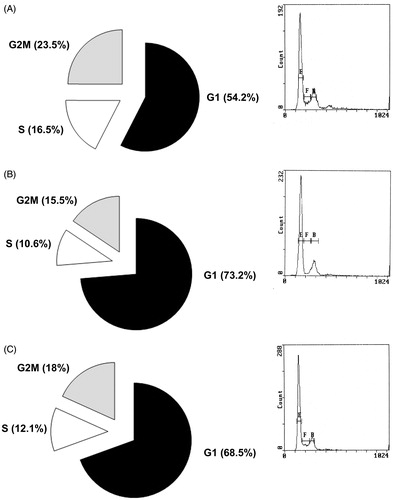
Figure 3. DNA Cell cycle progression in LNCaP cells treated by unconditioned DMEM (A left panel), Day 3 (B left panel) or 1 week (C left panel) AMSCs Conditioned Media as assessed by Propidium Iodide staining followed by Flow Cytometry. A, B and C right panels: representative plots of FACS analysis, E = G1 phase; F = G2/M phase; B = S phase.
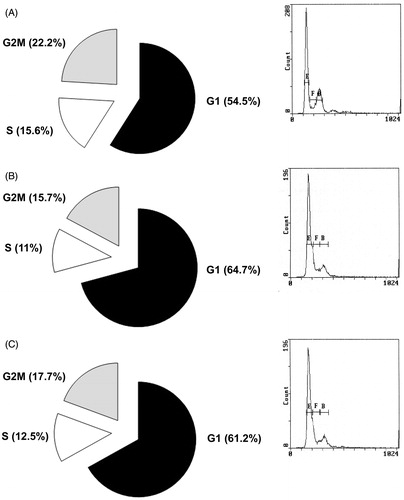
Figure 4. DNA Cell cycle progression in PC3 cells treated by unconditioned DMEM (A left panel), Day 3 (B left panel) or 1 week (C left panel) AMSCs Conditioned Media as assessed by Propidium Iodide staining followed by Flow Cytometry. A, B and C right panels: representative plots of FACS analysis, E = G1 phase; F = G2/M phase; B = S phase.