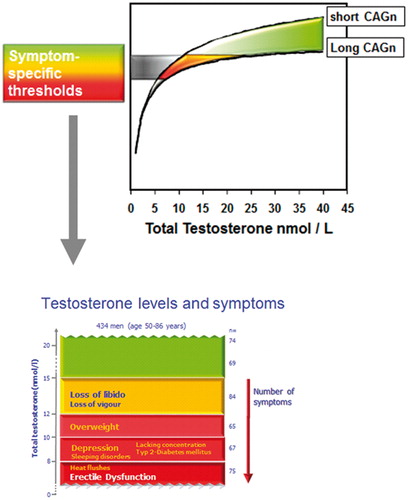
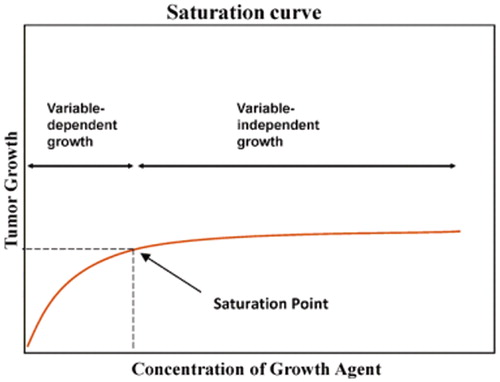
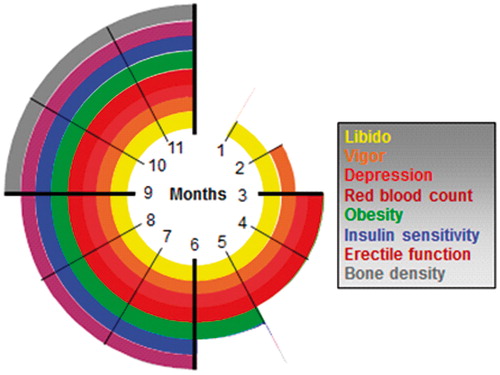
8,934
Views
222
CrossRef citations to date
0
Altmetric
Original Article

Recommendations on the diagnosis, treatment and monitoring of hypogonadism in men

, , , , , & show all
Pages 5-15 | Received 25 Dec 2014, Accepted 26 Dec 2014, Published online: 06 Feb 2015

Figures & data

Figure 1. Threshold continuum to hypogonadism.

Figure 1. Threshold continuum to hypogonadism.

Figure 2. Saturation curve, demonstrating the relationship between testosterone and prostate cancer.

Figure 2. Saturation curve, demonstrating the relationship between testosterone and prostate cancer.

Figure 3. Time-dependent onset of effects of testosterone substitution therapy.

Figure 3. Time-dependent onset of effects of testosterone substitution therapy.