Figures & data
Table 1. Flow cytometry analysis of surface molecule expression on non-obese or obese mouse and human adipose stem cells. The table represents the mean of three independent experiments.
Figure 1. Adipose stem cells migration and invasion. Migration Transwell assay performed in mouse adipose stem cells (A) and human adipose stem cells (B). ASCs were induced to migrate in presence of different cytokines at low concentration (50 ng/ml IL8 and SDF-1; 80 ng/ml MCP-1; 30 ng/ml TNF-α; 50 ng/ml HMGB1) and at high concentration (150 ng/ml IL8 and SDF-1; 240 ng/ml MCP-1; 90 ng/ml TNF-α; 150 ng/ml HMGB1). The graphic represents the mean of five independent experiments. Invasion assay performed in mouse adipose stem cells (C) and human adipose stem cells (D). Invasion capacity was analysed using gelatin coated membrane and ASCs were induced to transmigrate in presence of different cytokines (50 ng/ml IL8 and SDF-1; 80 ng/ml MCP-1; 30 ng/ml TNF-α; 50 ng/ml HMGB1). *p < 0.05; **p < 0.01; ***p < 0.001; +++p < 0.001 (+ differences between non-obese and obese ASCs and * differences inside the group). The graphic represents the mean of five independent experiments.
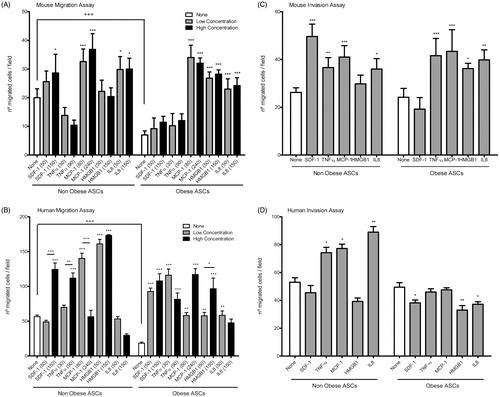
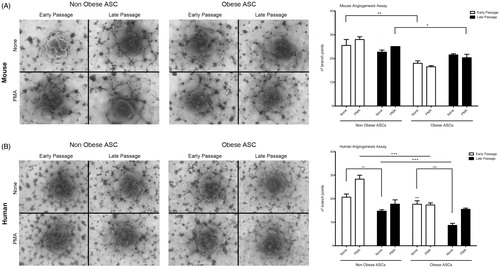
Figure 2. Angiogenesis of adipose stem cells. Representative images of the capillaries structures formed on Matrigel by mouse adipose stem cells (A) and human adipose stem cells (B) both at early and late passages. ASCs were incubated in presence or absence of PMA (100 ng/ml) stimuli. Capillary tubules were quantified as branch points numbers and are represented in the graphic. +p < 0.05; ++p < 0.01; +++p < 0.001 (differences between non-obese and obese ASCs) and **p < 0.01; ***p < 0.001 (differences inside the group). The graphic represents the mean of six independent experiments.