3,439
Views
30
CrossRef citations to date
0
Altmetric
Research Article

Effects of pearl powder extract and its fractions on fibroblast function relevant to wound repair

, , , , &
Pages 122-127 | Received 23 May 2008, Accepted 01 Dec 2008, Published online: 24 Dec 2009

Figures & data

Table 1. Yield and protein content of the extract and fractions.

Figure 1. Morphological appearance of mouse oral fibroblasts: (A) fibroblasts in primary culture; (B) fibroblasts subcultured to the second generation; (C) fibroblasts subcultured to the third generation.

Figure 1.  Morphological appearance of mouse oral fibroblasts: (A) fibroblasts in primary culture; (B) fibroblasts subcultured to the second generation; (C) fibroblasts subcultured to the third generation.

Figure 2. Effects of WSM, MR14, MR3–14, and MR3 on the growth of fibroblasts (μg/mL): (A) after 48 h incubation, (B) after 72 h incubation. Values shown represent the mean ± SEM (n = 5). *p < 0.05, **p < 0.01.
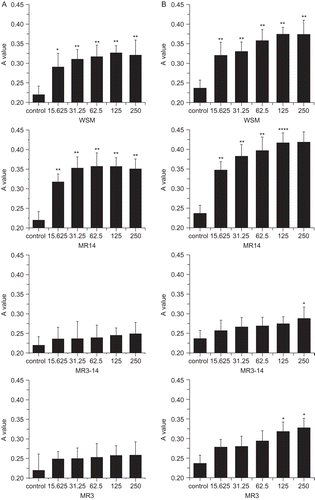
Figure 2.  Effects of WSM, MR14, MR3–14, and MR3 on the growth of fibroblasts (μg/mL): (A) after 48 h incubation, (B) after 72 h incubation. Values shown represent the mean ± SEM (n = 5). *p < 0.05, **p < 0.01.

Figure 3. Effects of WSM, MR14, MR3–14, and MR3 on growth curves of fibroblasts. Data represent the mean ± SEM (n = 5). *p < 0.05, **p < 0.01.
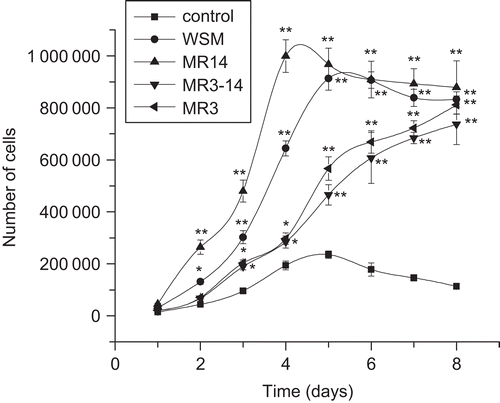
Figure 3.  Effects of WSM, MR14, MR3–14, and MR3 on growth curves of fibroblasts. Data represent the mean ± SEM (n = 5). *p < 0.05, **p < 0.01.

Figure 4. Effects of WSM, MR14, MR3–14, and MR3 on collagen production. Results are expressed as the mean ± SEM (n = 5) *p < 0.05, **p < 0.01.
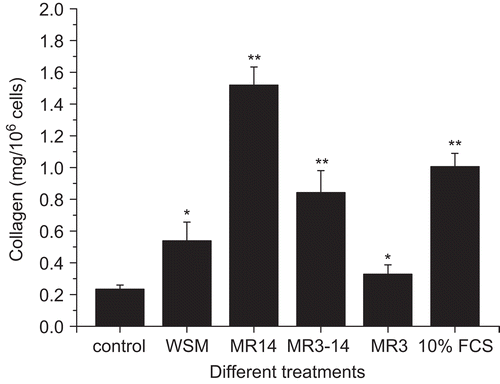
Figure 4.  Effects of WSM, MR14, MR3–14, and MR3 on collagen production. Results are expressed as the mean ± SEM (n = 5) *p < 0.05, **p < 0.01.

Figure 5. Effects of WSM, MR14, MR3–14, and MR3 on MMP-2, -9 activities. (A) Results of gelatin zymography. Lane 1: WSM; lane 2: MR14; lane 3: MR3–14; lane 4: MR3; lane 5: 1% FCS control; lane 6: 10% FCS control. (B) Activities of MMP-2, -9 expressed as multiplication product of zone area and average gray value. Data represent the mean ± SEM (n = 5). *p < 0.05, **p < 0.01.
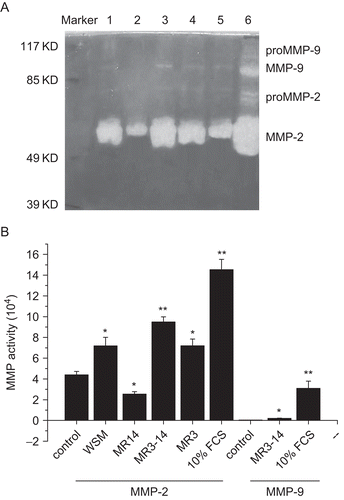
Figure 5.  Effects of WSM, MR14, MR3–14, and MR3 on MMP-2, -9 activities. (A) Results of gelatin zymography. Lane 1: WSM; lane 2: MR14; lane 3: MR3–14; lane 4: MR3; lane 5: 1% FCS control; lane 6: 10% FCS control. (B) Activities of MMP-2, -9 expressed as multiplication product of zone area and average gray value. Data represent the mean ± SEM (n = 5). *p < 0.05, **p < 0.01.

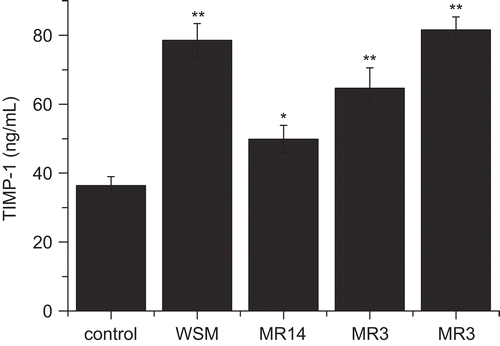
Figure 6. Effects of WSM, MR14, MR3–14, and MR3 on the production of TIMP-1, Data are expressed as the mean ± SEM (ng/mL). *p < 0.05, **p < 0.01.

Figure 6.  Effects of WSM, MR14, MR3–14, and MR3 on the production of TIMP-1, Data are expressed as the mean ± SEM (ng/mL). *p < 0.05, **p < 0.01.

Reprints and Corporate Permissions

Please note: Selecting permissions does not provide access to the full text of the article, please see our help page How do I view content?

To request a reprint or corporate permissions for this article, please click on the relevant link below:

Academic Permissions

Please note: Selecting permissions does not provide access to the full text of the article, please see our help page How do I view content?

Obtain permissions instantly via Rightslink by clicking on the button below:

If you are unable to obtain permissions via Rightslink, please complete and submit this Permissions form. For more information, please visit our Permissions help page.