1,447
Views
33
CrossRef citations to date
0
Altmetric
Original Article

Effect of myricetin on blood pressure and metabolic alterations in fructose hypertensive rats

, , &
Pages 494-498 | Received 25 Oct 2008, Accepted 18 Feb 2009, Published online: 19 Apr 2010

Figures & data

Figure 1. Effect of myricetin on systolic blood pressure (S.B.P.) in rats. n = 5 rats per group. Data are expressed as mean ± SEM. *p < 0.05 when compared to control and p < 0.05 when compared to fructose-treated group. F, fructose; M, myricetin.

Figure 1.  Effect of myricetin on systolic blood pressure (S.B.P.) in rats. n = 5 rats per group. Data are expressed as mean ± SEM. *p < 0.05 when compared to control and †p < 0.05 when compared to fructose-treated group. F, fructose; M, myricetin.
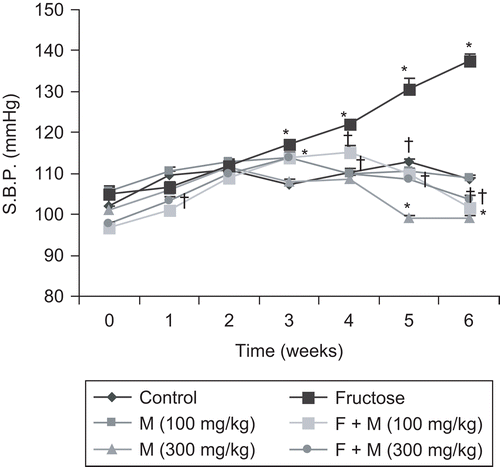
Figure 2. Mean change in blood pressure (B.P.) with various drugs: adrenaline (Adr, 1 µg/kg), noradrenaline (NA, 1 µg/kg), phenylephrine (PE, 1 µg/kg), and angiotensin II (Ang II, 25 ng/kg) in rats. Data are expressed as mean ± SEM. *p < 0.05 when compared to control and p < 0.05 when compared to fructose-treated group. F, fructose; M, myricetin.

Figure 2.  Mean change in blood pressure (B.P.) with various drugs: adrenaline (Adr, 1 µg/kg), noradrenaline (NA, 1 µg/kg), phenylephrine (PE, 1 µg/kg), and angiotensin II (Ang II, 25 ng/kg) in rats. Data are expressed as mean ± SEM. *p < 0.05 when compared to control and †p < 0.05 when compared to fructose-treated group. F, fructose; M, myricetin.
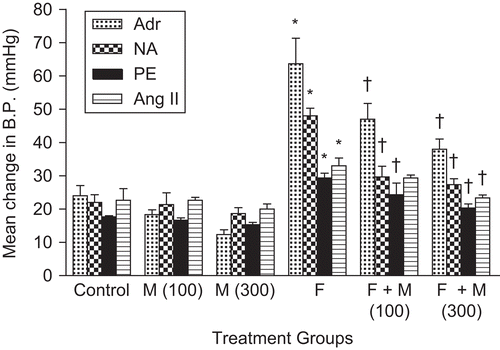
Table 1. Effect of myricetin on gain in body weight, heart rate, and serum concentrations of glucose, cholesterol, triglycerides, and insulin in fructose hypertensive rats.

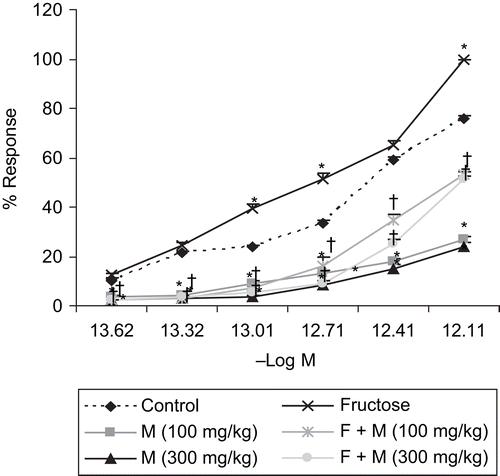
Figure 3. Effect of myricetin on the cumulative concentration–response curve (CCRC) of angiotensin II on isolated rat ascending colon in rats. n = 5 rats per group. Data are expressed as mean ± SEM. *p < 0.05 when compared to control and p < 0.05 when compared to fructose-treated group. F, fructose; M, myricetin.

Figure 3.  Effect of myricetin on the cumulative concentration–response curve (CCRC) of angiotensin II on isolated rat ascending colon in rats. n = 5 rats per group. Data are expressed as mean ± SEM. *p < 0.05 when compared to control and †p < 0.05 when compared to fructose-treated group. F, fructose; M, myricetin.
Reprints and Corporate Permissions

Please note: Selecting permissions does not provide access to the full text of the article, please see our help page How do I view content?

To request a reprint or corporate permissions for this article, please click on the relevant link below:

Academic Permissions

Please note: Selecting permissions does not provide access to the full text of the article, please see our help page How do I view content?

Obtain permissions instantly via Rightslink by clicking on the button below:

If you are unable to obtain permissions via Rightslink, please complete and submit this Permissions form. For more information, please visit our Permissions help page.