2,434
Views
37
CrossRef citations to date
0
Altmetric
Research Article

Antioxidant and hepatoprotective activities of Egyptian moraceous plants against carbon tetrachloride-induced oxidative stress and liver damage in rats

, , &
Pages 1255-1264 | Received 28 Oct 2009, Accepted 24 Feb 2010, Published online: 14 Sep 2010

Figures & data

Table 1. Effect of methanol extracts of Ficus carica (F.c.) leaves, fruits and Morus alba (M.a.) root bark on blood glutathione (GSH) content, activity levels of superoxide dismutase (SOD), catalase (CAT) and malondialdehyde (MDA) content in rats that received CCl4.

Table 2. Effect of methanol extracts of Ficus carica (F.c.) leaves, fruits and Morus alba (M.a.) root bark on plasma ALT, AST, ALP activity levels, total protein and total bilirubin in rats that received CCl4.

Table 3. Effect of methanol extracts of Ficus carica (F.c.) leaves, fruits and Morus alba (M.a.) root bark on plasma urea (UR) and creatinine (CR) contents in rats that received CCl4.

Figure 1. Microphotograph of liver sections taken from rats of the control group. H and E staining (× 400).
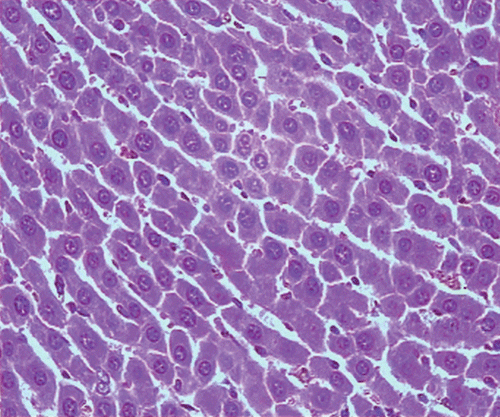
Figure 1.  Microphotograph of liver sections taken from rats of the control group. H and E staining (× 400).

Figure 2. Microphotograph of liver sections taken from rats of CCl4 group, (1 mL/kg of 40% solution, s.c.). H and E staining (× 400).
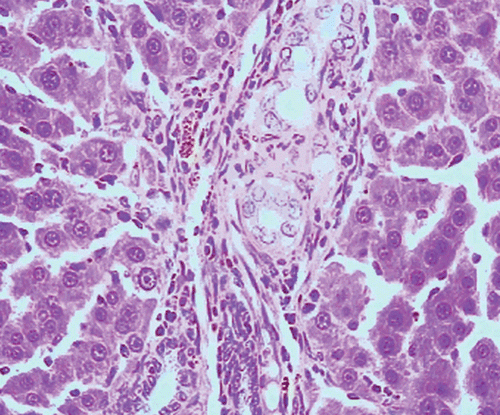
Figure 2.  Microphotograph of liver sections taken from rats of CCl4 group, (1 mL/kg of 40% solution, s.c.). H and E staining (× 400).

Figure 3. Microphotograph of liver sections taken from rats of silymarin treated group (50 mg/kg, i.p.). H and E staining (× 400).
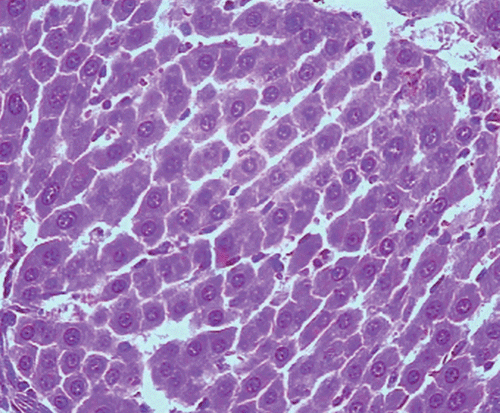
Figure 3.  Microphotograph of liver sections taken from rats of silymarin treated group (50 mg/kg, i.p.). H and E staining (× 400).

Figure 4. Microphotograph of liver sections taken from rats of F. carica leaves treated group (50 mg/kg, i.p.). H and E staining (× 400).
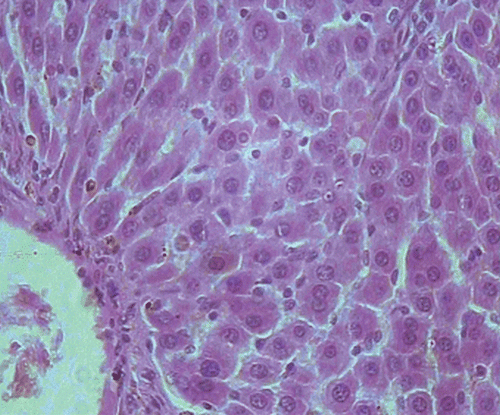
Figure 4.  Microphotograph of liver sections taken from rats of F. carica leaves treated group (50 mg/kg, i.p.). H and E staining (× 400).

Figure 5. Microphotograph of liver sections taken from rats of M. alba root bark treated group (50 mg/kg, i.p.). H and E staining (× 400).
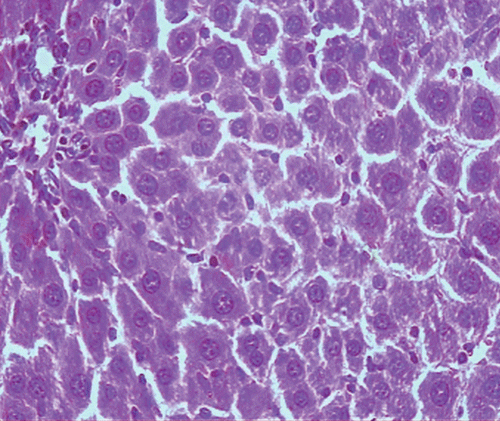
Figure 5.  Microphotograph of liver sections taken from rats of M. alba root bark treated group (50 mg/kg, i.p.). H and E staining (× 400).
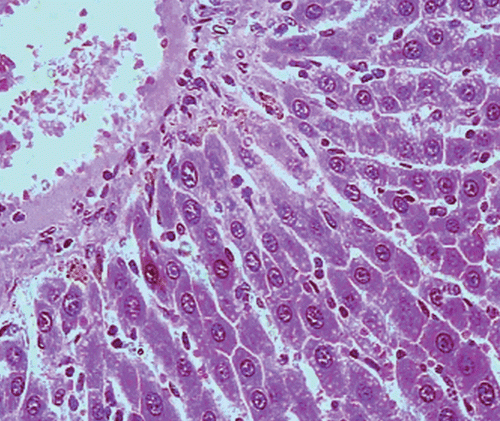
Figure 6. Microphotograph of liver sections taken from rats of F. carica fruits treated group (150 mg/kg, i.p.). H and E staining (× 400).

Figure 6.  Microphotograph of liver sections taken from rats of F. carica fruits treated group (150 mg/kg, i.p.). H and E staining (× 400).

Reprints and Corporate Permissions

Please note: Selecting permissions does not provide access to the full text of the article, please see our help page How do I view content?

To request a reprint or corporate permissions for this article, please click on the relevant link below:

Academic Permissions

Please note: Selecting permissions does not provide access to the full text of the article, please see our help page How do I view content?

Obtain permissions instantly via Rightslink by clicking on the button below:

If you are unable to obtain permissions via Rightslink, please complete and submit this Permissions form. For more information, please visit our Permissions help page.