714
Views
17
CrossRef citations to date
0
Altmetric
Research Article

The mechanisms of action of Tianhua on antitumor activity in lung cancer cells

, , , , , & show all
Pages 1302-1309 | Received 25 Nov 2009, Accepted 18 Mar 2010, Published online: 25 Aug 2010

Figures & data

Figure 1. (A) Morphological changes of A549 and WI-38 after treatment with TH-R for 72 h; 24 h after plating, cells were exposed to various concentrations of TH-R (0, 2, 4, 8 mg/mL) for 72 h. (B) The cytotoxic effect of TH-R in A549 lung cancer and WI-38 cells for 72 h after treatment with various concentrations of TH-R using a cellular viability assay (MTS assay). (C) The cytotoxic effect of TH-R treatment for 8 h, 24 h and 48 h in A549 cells. The data are presented as mean ± SD of triplicate experiments. * indicates a P <0.05 with Student’s t-test, as compared with untreated cells. Columns, means of three determinations; bars, SD. (* means P <0.05). Each cell treatment concentration as repeated in three separate experiments.
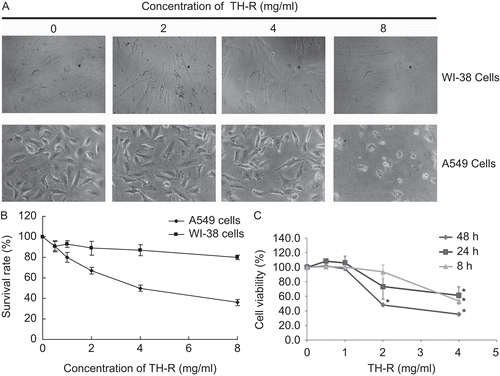
Figure 1.  (A) Morphological changes of A549 and WI-38 after treatment with TH-R for 72 h; 24 h after plating, cells were exposed to various concentrations of TH-R (0, 2, 4, 8 mg/mL) for 72 h. (B) The cytotoxic effect of TH-R in A549 lung cancer and WI-38 cells for 72 h after treatment with various concentrations of TH-R using a cellular viability assay (MTS assay). (C) The cytotoxic effect of TH-R treatment for 8 h, 24 h and 48 h in A549 cells. The data are presented as mean ± SD of triplicate experiments. * indicates a P <0.05 with Student’s t-test, as compared with untreated cells. Columns, means of three determinations; bars, SD. (* means P <0.05). Each cell treatment concentration as repeated in three separate experiments.

Figure 2. Cell cycle changes after treatment with TH-R for 48 h by flow cytometry in A549 cells. Cultured A549 cells (5 × 105 cells) were untreated or treated with 1, 2, 4 mg/mL TH-R for 48 h. The numbers of cells in the G1, S, and G2/M cell cycle phases were assessed by flow cytometry.
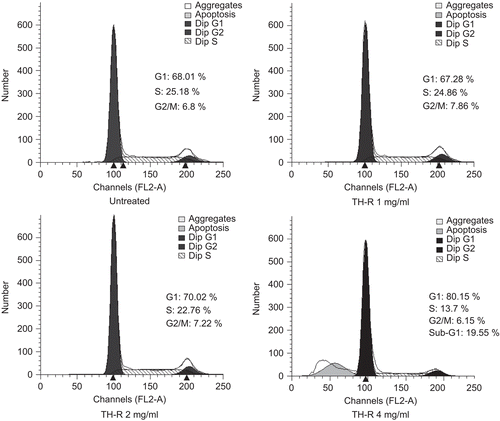
Figure 2.  Cell cycle changes after treatment with TH-R for 48 h by flow cytometry in A549 cells. Cultured A549 cells (5 × 105 cells) were untreated or treated with 1, 2, 4 mg/mL TH-R for 48 h. The numbers of cells in the G1, S, and G2/M cell cycle phases were assessed by flow cytometry.

Figure 3. Evaluation of the effect of TH-R on telomerase activity in A549 cells for 24 h. A549 cells were treated with varying concentrations (0, 0.25, 0.5, 1, 2, and 4 mg/mL) of TH-R for 24 h. Telomerase activity was detected on TRAP assays and the 36-base pair internal standard was used as a control. The data are representative of three independent experiments. NC (negative control, right lane): no telomerase extract was added.
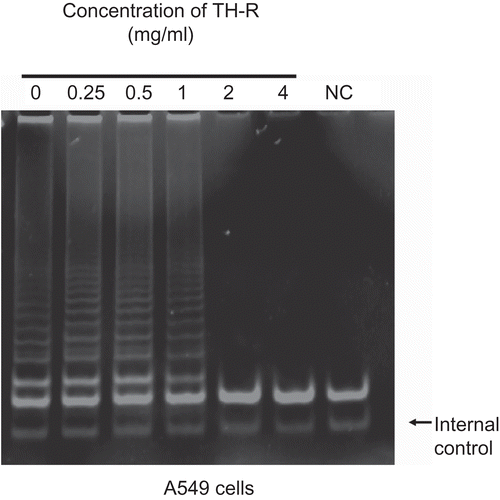
Figure 3.  Evaluation of the effect of TH-R on telomerase activity in A549 cells for 24 h. A549 cells were treated with varying concentrations (0, 0.25, 0.5, 1, 2, and 4 mg/mL) of TH-R for 24 h. Telomerase activity was detected on TRAP assays and the 36-base pair internal standard was used as a control. The data are representative of three independent experiments. NC (negative control, right lane): no telomerase extract was added.

Figure 4. TH-R had an aggregation effect on peripheral blood lymphocytes, but no effect on stimulating peripheral lymphocytes to produce human interferon-γ (IFN-γ).
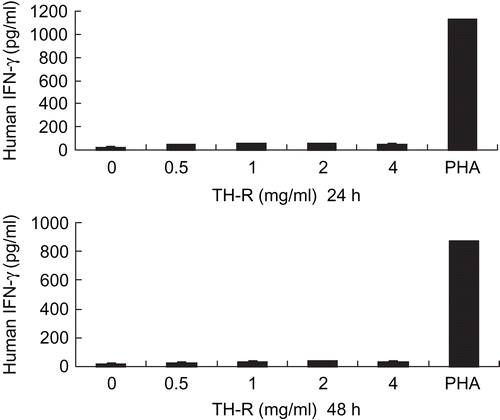
Figure 4.  TH-R had an aggregation effect on peripheral blood lymphocytes, but no effect on stimulating peripheral lymphocytes to produce human interferon-γ (IFN-γ).

Figure 5. Effect of TH-R on migration of A549 cells treated for 8 h. A549 cells were treated with various concentrations (0, 0.25, 0.5, 1, 2, and 4 mg/mL) of TH-R and were assessed with a cell migration assay. The higher density in this cell scanning picture is representative of more cells that passed through and adhered to the membrane. After about 8 h, the migrated A549 cells passed through the membrane. (B) They were quantified by counting the cells that migrated onto the membrane. Cells were fixed, stained, and counted as described in the text. The data represent mean ± SD.
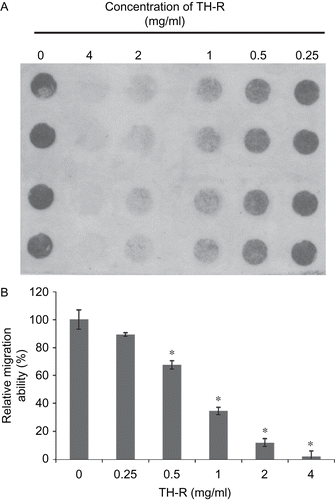
Figure 5.  Effect of TH-R on migration of A549 cells treated for 8 h. A549 cells were treated with various concentrations (0, 0.25, 0.5, 1, 2, and 4 mg/mL) of TH-R and were assessed with a cell migration assay. The higher density in this cell scanning picture is representative of more cells that passed through and adhered to the membrane. After about 8 h, the migrated A549 cells passed through the membrane. (B) They were quantified by counting the cells that migrated onto the membrane. Cells were fixed, stained, and counted as described in the text. The data represent mean ± SD.

Figure 6. Inhibitory effects of TH-R on tumor growth in vivo. (A) Approximately 1 × 107 A549 cells were subcutaneously injected into each flank of the studied mice to initiate tumor growth. Once tumors started to grow, their sizes were measured every three days and the tumor volume was calculated. Seven days after cell implantation the control group continued to receive sterilized PBS, whereas the experimental animals received TH-R (0.1 mL/mouse under the concentration of 180 mg/mL) via gastric tube feeding on day 7, then day 11 and every other day until day 30. Mice from each group were sacrificed every thirty-three days with tumor resection. (B) Average tumor volumes were measured with different treatments of TH-R and the tumor growth curves were analyzed. *Illustrates that the treated were significantly different from controls.
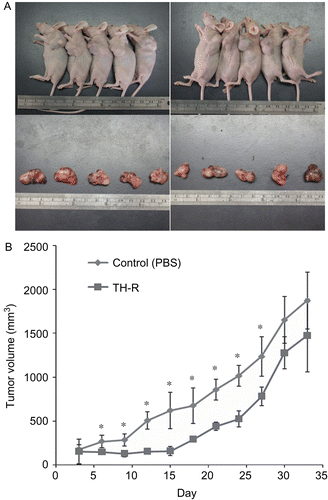
Figure 6.  Inhibitory effects of TH-R on tumor growth in vivo. (A) Approximately 1 × 107 A549 cells were subcutaneously injected into each flank of the studied mice to initiate tumor growth. Once tumors started to grow, their sizes were measured every three days and the tumor volume was calculated. Seven days after cell implantation the control group continued to receive sterilized PBS, whereas the experimental animals received TH-R (0.1 mL/mouse under the concentration of 180 mg/mL) via gastric tube feeding on day 7, then day 11 and every other day until day 30. Mice from each group were sacrificed every thirty-three days with tumor resection. (B) Average tumor volumes were measured with different treatments of TH-R and the tumor growth curves were analyzed. *Illustrates that the treated were significantly different from controls.

Reprints and Corporate Permissions

Please note: Selecting permissions does not provide access to the full text of the article, please see our help page How do I view content?

To request a reprint or corporate permissions for this article, please click on the relevant link below:

Academic Permissions

Please note: Selecting permissions does not provide access to the full text of the article, please see our help page How do I view content?

Obtain permissions instantly via Rightslink by clicking on the button below:

If you are unable to obtain permissions via Rightslink, please complete and submit this Permissions form. For more information, please visit our Permissions help page.