1,830
Views
18
CrossRef citations to date
0
Altmetric
Research Article

Antioxidant, antihyperuricemic and xanthine oxidase inhibitory activities of Hyoscyamus reticulatus

, , , , , , , & show all
Pages 1376-1383 | Received 04 Jul 2009, Accepted 02 Apr 2010, Published online: 25 Aug 2010

Figures & data

Figure 1. (A) Concentration-response curve for the absorbance at 405 nm for ABTS•+ as a function of standard Trolox solution. Data are expressed as mean of three replicates ± SEM. (B) ABTS•+ scavenging capacities of five concentrations of H. reticulatus aqueous extract. Data are expressed as the mean of three replicates.
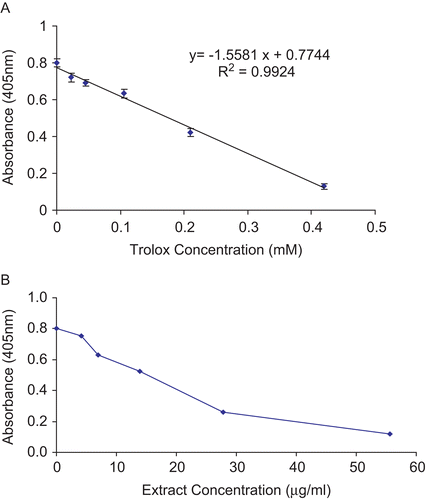
Figure 1.  (A) Concentration-response curve for the absorbance at 405 nm for ABTS•+ as a function of standard Trolox solution. Data are expressed as mean of three replicates ± SEM. (B) ABTS•+ scavenging capacities of five concentrations of H. reticulatus aqueous extract. Data are expressed as the mean of three replicates.

Figure 2. Effects of H. reticulatus aqueous extract and allopurinol on serum urate levels in the hyperuricemic mice pretreated with the potassium oxonate. Data represent mean values (± SEM) of urate levels in serum (mg/dL) in the groups of animals (n = 5). #P <0.001 vs. normal control group, *P <0.01, **P <0.001 versus hyperuricemic control group.
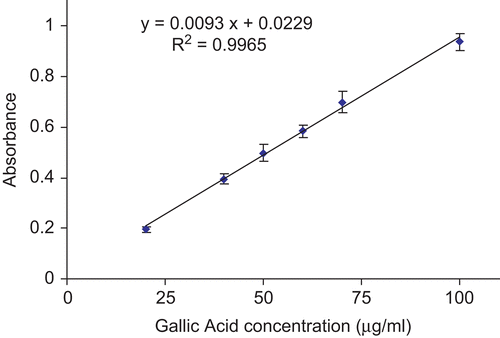
Figure 2.  Effects of H. reticulatus aqueous extract and allopurinol on serum urate levels in the hyperuricemic mice pretreated with the potassium oxonate. Data represent mean values (± SEM) of urate levels in serum (mg/dL) in the groups of animals (n = 5). #P <0.001 vs. normal control group, *P <0.01, **P <0.001 versus hyperuricemic control group.

Table 1. Average serum urate levels of oxonate-Balb/c mice after oral administration of three doses of H. reticulatus extract concentrations (200, 400 and 600 mg/kg).
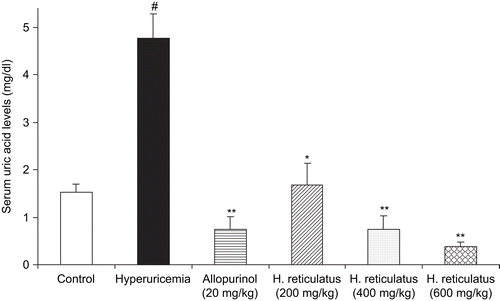
Figure 3. Concentration-response curve for the absorbance at 765 nm for gallic acid standard. Data are expressed as mean of three replicates ± SEM.

Figure 3.  Concentration-response curve for the absorbance at 765 nm for gallic acid standard. Data are expressed as mean of three replicates ± SEM.

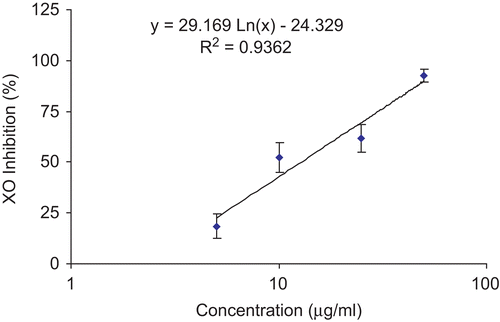
Figure 4. The inhibitory effect of H. reticulatus aqueous extract concentrations on the activity of XO. Data are expressed as the mean of three replicates ± SEM.

Figure 4.  The inhibitory effect of H. reticulatus aqueous extract concentrations on the activity of XO. Data are expressed as the mean of three replicates ± SEM.

Reprints and Corporate Permissions

Please note: Selecting permissions does not provide access to the full text of the article, please see our help page How do I view content?

To request a reprint or corporate permissions for this article, please click on the relevant link below:

Academic Permissions

Please note: Selecting permissions does not provide access to the full text of the article, please see our help page How do I view content?

Obtain permissions instantly via Rightslink by clicking on the button below:

If you are unable to obtain permissions via Rightslink, please complete and submit this Permissions form. For more information, please visit our Permissions help page.