Figures & data
Figure 1. Concentration-dependent inhibitory effect on spontaneous and K+ (80 mM)-induced contractions of (A) petroleum spirit (HpPet), (B) chloroform (HpCHCl3), (C) ethyl acetate (HpEtAc), (D) aqueous (HpAq) fractions of Hypericum perforatum, (E) papaverine, and (F) verapamil in isolated rabbit jejunum preparations. Values shown are mean ± SEM, n = 3–6.
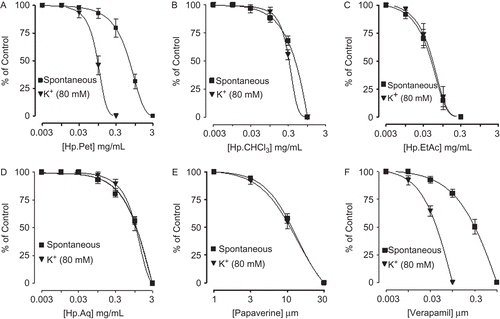
Figure 2. Concentration-response curves of Ca++ in the absence and presence of different concentrations of (A) petroleum spirit (HpPet), (B) chloroform (HpCHCl3), (C) ethyl acetate (HpEtAc), (D) aqueous (HpAq) fractions of Hypericum perforatum, (E) papaverine, and (F) verapamil in isolated rabbit jejunum preparations. Values shown are mean ± SEM, n = 3–5.
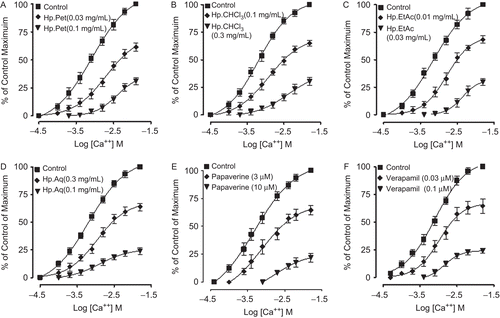
Figure 3. Inhibitory concentration-response curves of isoprenaline against carbachol (CCh)-induced contractions in the absence and presence of different concentrations of petroleum spirit (HpPet), chloroform (HpCHCl3), ethyl acetate (HpEtAc), aqueous (HpAq) fractions of Hypericum perforatum, papaverine, and verapamil in isolated rabbit jejunum preparations. Values shown are mean ± SEM, n = 3–4. The curves obtained by pretreatment of tissues with HpCHCl3, HpEtAc, HpAq, and papaverine are significantly different from the respective isoprenaline control curves (p <0.05), while that constructed in the presence of HpPet and verapamil are not significantly different (p >0.05), Student’s t-test.
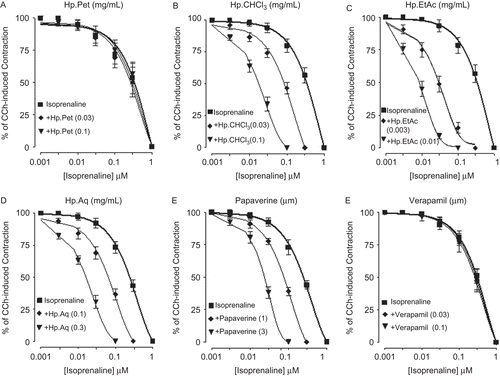
Figure 4. Concentration-response curves showing effect of (A) petroleum spirit (HpPet), (B) chloroform (HpCHCl3), (C) ethyl acetate (HpEtAc), (D) aqueous (HpAq) fractions of Hypericum perforatum, (E) papaverine, and (F) verapamil on carbachol (CCh) and K+-induced contractions in isolated guinea-pig tracheal preparations. Values shown are mean ± SEM, n = 3–5.
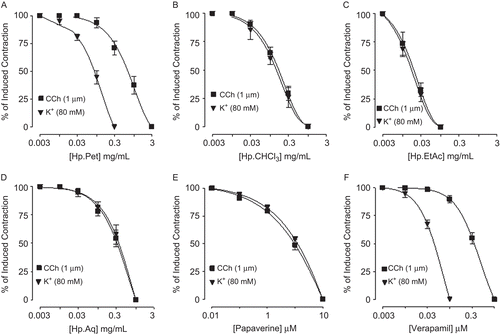
Figure 5. Inhibitory concentration-response curves of isoprenaline against carbachol (CCh)-induced contractions in the absence and presence of different concentrations of petroleum spirit (HpPet), chloroform (HpCHCl3), ethyl acetate (HpEtAc), aqueous (HpAq) fractions of Hypericum perforatum, papaverine, and verapamil in isolated guinea-pig tracheal preparations. Values shown are mean ± SEM, n = 3–4. The curves obtained by pretreatment of tissues with HpCHCl3, HpEtAc, HpAq, and papaverine are significantly different from the respective isoprenaline control curves (p <0.05), while that constructed in the presence of HpPet and verapamil are not significantly different (p >0.05), Student’s t-test.
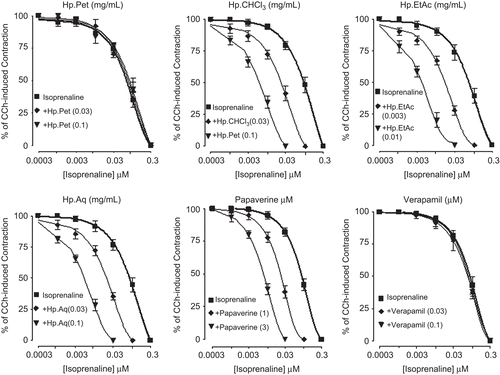
Figure 6. Concentration-response curves showing effect of (A) petroleum spirit (HpPet), (B) chloroform (HpCHCl3), (C) ethyl acetate (HpEtAc), (D) aqueous (HpAq) fractions of Hypericum perforatum (E) papaverine, and (F) verapamil on the resting base line and agonist-induced contractions in isolated rabbit aorta preparations. The vasoconstrictor effect was studied on resting basal tension and expressed as % of phenylephrine maximum (PE Max.), while the vasodilator effect was studied against PE and K+-induced contractions. Values shown are mean ± SEM, n = 3–4.
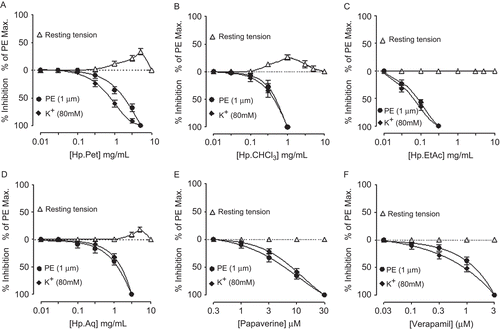
Figure 7. Effect of (A) petroleum spirit (HpPet), (B) chloroform (HpCHCl3), (C) ethyl acetate (HpEtAc), (D) aqueous (HpAq) fractions of Hypericum perforatum, (E) papaverine, and (F) verapamil on force of contraction of the spontaneously beating isolated guinea-pig right atrial preparations. Values shown are mean ± SEM, n = 3–4.
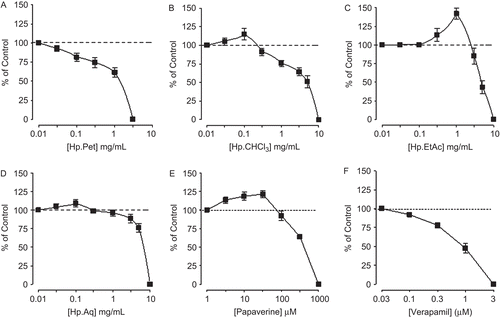
Figure 8. Concentration-dependent inhibitory effect of the Hypericum perforatum constituents: (A) hyperforin, (B) hypericin, and (C) hyperoside on spontaneous and K+ (80 mM)-induced contractions in isolated rabbit jejunum preparations. Values shown are mean ± SEM, n = 2.
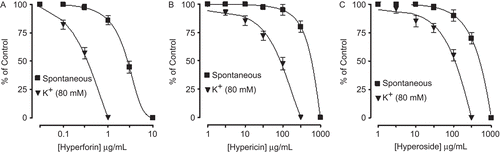
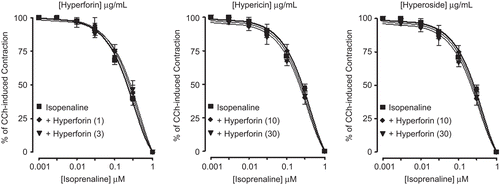
Figure 9. Inhibitory concentration-response curves of isoprenaline against carbachol (CCh)-induced contractions in the absence and presence of different concentrations of Hypericum perforatum pure compounds: hyperforin, hypericin, and hyperoside in isolated rabbit jejunum preparations. Values shown are mean ± SEM, n = 2. The curves constructed in the presence of hyperforin, hypericin, and hyperoside are not significantly different from the respective isoprenaline control curves (p >0.05), Student’s t-test.