1,131
Views
30
CrossRef citations to date
0
Altmetric
Research Article

Protective effects of the aqueous extract of Scutellaria baicalensis against acrolein-induced oxidative stress in cultured human umbilical vein endothelial cells

, , , , , & show all
Pages 256-261 | Received 01 Mar 2010, Accepted 14 Jun 2010, Published online: 28 Oct 2010

Figures & data

Figure 1.  Effects of SbG on HUVE cell viability and cytotoxic effect of acrolein on HUVE cells. The cells were treated with SbG or acrolein for 24 h at appropriate concentrations. MTT was conducted for the cell viability assay. Data were presented as mean±SEM of results in three independent experiments. Each experiment was performed in triplicate. *P< 0.05, **P <0.001 versus control (black bar).
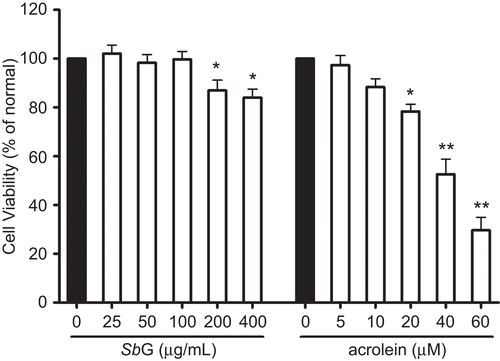
Figure 1.  Effects of SbG on HUVE cell viability and cytotoxic effect of acrolein on HUVE cells. The cells were treated with SbG or acrolein for 24 h at appropriate concentrations. MTT was conducted for the cell viability assay. Data were presented as mean±SEM of results in three independent experiments. Each experiment was performed in triplicate. *P< 0.05, **P <0.001 versus control (black bar).

Figure 2.  Protective effects of SbG pretreatment at 50 and 100 μg/ml showing the protection against acrolein-induced cytotoxicity in the HUVE cells. Cells were plated in the 96-well plate and SbG at different concentrations were loaded into the appropriate wells and incubated for 24 h. The media was discarded and the cells were continuously cultured in the presence or absence of acrolein for another 24 h. MTT was conducted for cell viability. Data were expressed as mean±SEM of the results of three independent experiments. *P < 0.05, **P < 0.01 vs acrolein alone groups.
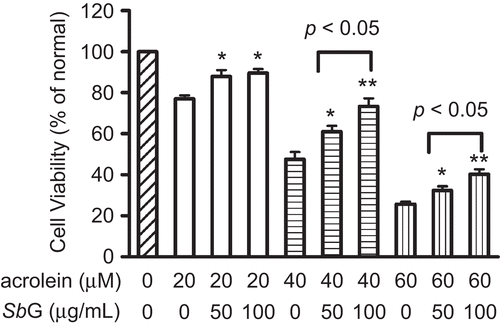
Figure 2.  Protective effects of SbG pretreatment at 50 and 100 μg/ml showing the protection against acrolein-induced cytotoxicity in the HUVE cells. Cells were plated in the 96-well plate and SbG at different concentrations were loaded into the appropriate wells and incubated for 24 h. The media was discarded and the cells were continuously cultured in the presence or absence of acrolein for another 24 h. MTT was conducted for cell viability. Data were expressed as mean±SEM of the results of three independent experiments. *P < 0.05, **P < 0.01 vs acrolein alone groups.

Figure 3.  Effects of SbG on cellular GSH levels and GST activity. HUVE cells were incubated with 50 and 100µg/ml SBG for 24 h. GSH contents were evaluated (*P < 0.05 vs the control). However, no significant GST activity changes were observed in the SbG treated when compared with the control group. Data were presented as mean ±SEM of the results of three independent experiments.
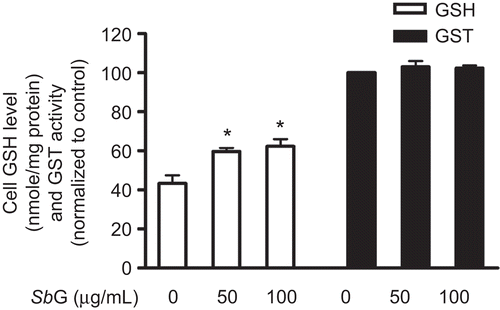
Figure 3.  Effects of SbG on cellular GSH levels and GST activity. HUVE cells were incubated with 50 and 100µg/ml SBG for 24 h. GSH contents were evaluated (*P < 0.05 vs the control). However, no significant GST activity changes were observed in the SbG treated when compared with the control group. Data were presented as mean ±SEM of the results of three independent experiments.

Figure 4.  Protective effects of SbG on HUVE cells. The cells were treated with acrolein for 24 h at different concentrations. In the another set of the experiment, the cells were pretreated with 100 µg/mL SbG. Data were presented as mean±SEM of three independent experiments. *P <0.05, ** P < 0.01 versus the control, # P < 0.05, versus the acrolein alone group.
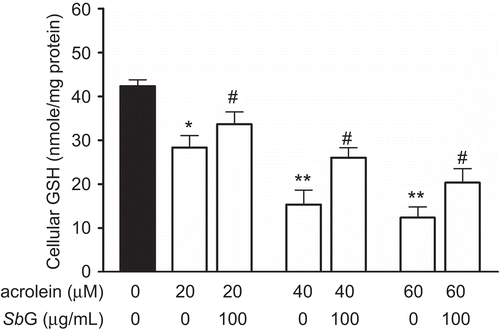
Figure 4.  Protective effects of SbG on HUVE cells. The cells were treated with acrolein for 24 h at different concentrations. In the another set of the experiment, the cells were pretreated with 100 µg/mL SbG. Data were presented as mean±SEM of three independent experiments. *P <0.05, ** P < 0.01 versus the control, # P < 0.05, versus the acrolein alone group.

Figure 5.  After 24 h pretreatment of 100 µg/mL SbG, mRNA levels of both GCLC and GCLM were elevated. Acrolein (40 µM) treatment inhibited the SbG induced GCLC mRNA up-regulation levels. Data were mean±SEM of three independent experiments. *P <0.05, ** P < 0.01 versus the control; # P < 0.05, versus the SBG alone group.
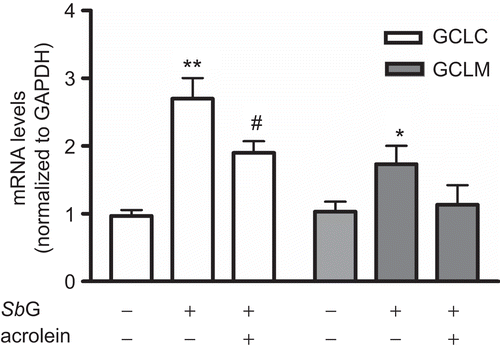
Figure 5.  After 24 h pretreatment of 100 µg/mL SbG, mRNA levels of both GCLC and GCLM were elevated. Acrolein (40 µM) treatment inhibited the SbG induced GCLC mRNA up-regulation levels. Data were mean±SEM of three independent experiments. *P <0.05, ** P < 0.01 versus the control; # P < 0.05, versus the SBG alone group.

Reprints and Corporate Permissions

Please note: Selecting permissions does not provide access to the full text of the article, please see our help page How do I view content?

To request a reprint or corporate permissions for this article, please click on the relevant link below:

Academic Permissions

Please note: Selecting permissions does not provide access to the full text of the article, please see our help page How do I view content?

Obtain permissions instantly via Rightslink by clicking on the button below:

If you are unable to obtain permissions via Rightslink, please complete and submit this Permissions form. For more information, please visit our Permissions help page.