1,382
Views
26
CrossRef citations to date
0
Altmetric
Original Article

The anti-angiogenic herbal composition Ob-X from Morus alba, Melissa officinalis, and Artemisia capillaris regulates obesity in genetically obese ob/ob mice

&
Pages 614-619 | Received 12 Sep 2010, Accepted 09 Nov 2010, Published online: 09 May 2011

Figures & data

Figure 1.  Effects of Ob-X on in vivo angiogenic activity. (A) Matrigel plugs removed from control group or Ob-X group were photographed. (B) Sections of each matrigel plug stained with H&E were examined by light microscopy (100×). (C) Hemoglobin contents in matrigel plugs.
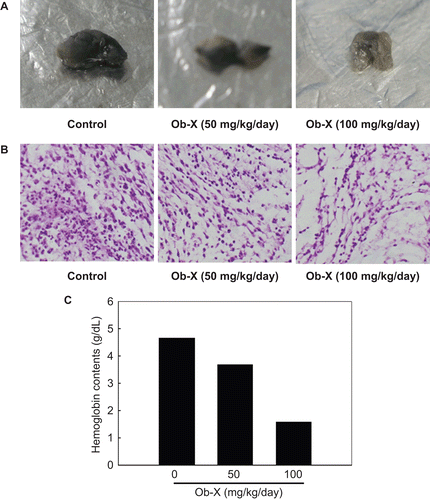
Figure 1.  Effects of Ob-X on in vivo angiogenic activity. (A) Matrigel plugs removed from control group or Ob-X group were photographed. (B) Sections of each matrigel plug stained with H&E were examined by light microscopy (100×). (C) Hemoglobin contents in matrigel plugs.

Figure 2.  Effects of Ob-X on body weight gain and visceral adipose tissue mass in genetically obese ob/ob mice. Ob/ob mice (n = 8/group) received daily oral administration of saline (control group) or Ob-X at a dose of 0.5 mg/mouse/day (Ob-X group) for 5 weeks. All values are expressed as the mean ± SD. (A) Body weight gains at the end of the treatment period were statistically significant between the control group and the Ob-X group, (P < 0.05). (B) Mesenteric fat mass was measured. *Significantly different from control group, P < 0.05. (C) Visceral fat mass was apparently leaner in the Ob-X group than in the control group.
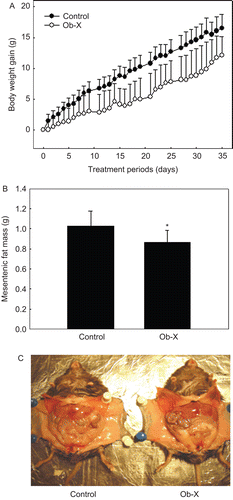
Figure 2.  Effects of Ob-X on body weight gain and visceral adipose tissue mass in genetically obese ob/ob mice. Ob/ob mice (n = 8/group) received daily oral administration of saline (control group) or Ob-X at a dose of 0.5 mg/mouse/day (Ob-X group) for 5 weeks. All values are expressed as the mean ± SD. (A) Body weight gains at the end of the treatment period were statistically significant between the control group and the Ob-X group, (P < 0.05). (B) Mesenteric fat mass was measured. *Significantly different from control group, P < 0.05. (C) Visceral fat mass was apparently leaner in the Ob-X group than in the control group.

Figure 3.  Light microscopic analysis of adipocytes in visceral adipose tissue of ob/ob mice. Adipose tissues were derived from mice receiving daily oral administration of saline (control group) or Ob-X at a dose of 0.5 mg/mouse/day (Ob-X group) for 5 weeks. Representative photographs of osmium tetroxide-stained sections of adipose tissues (original magnification 400×).
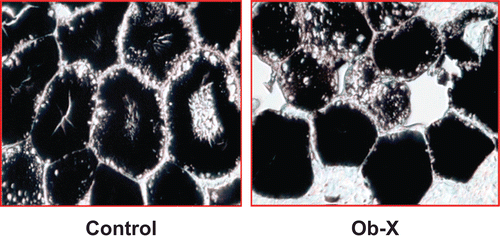
Figure 3.  Light microscopic analysis of adipocytes in visceral adipose tissue of ob/ob mice. Adipose tissues were derived from mice receiving daily oral administration of saline (control group) or Ob-X at a dose of 0.5 mg/mouse/day (Ob-X group) for 5 weeks. Representative photographs of osmium tetroxide-stained sections of adipose tissues (original magnification 400×).

Figure 4.  Effects of Ob-X on hepatic lipid accumulation in genetically obese ob/ob mice. Livers were derived from mice receiving daily oral administration of saline (control group) or Ob-X at a dose of 0.5 mg/mouse/day (Ob-X group) for 5 weeks. Representative photographs of osmium tetroxide-stained sections of livers (original magnification 200×).
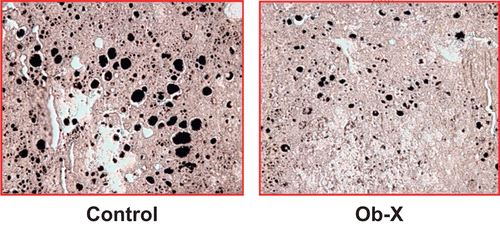
Figure 4.  Effects of Ob-X on hepatic lipid accumulation in genetically obese ob/ob mice. Livers were derived from mice receiving daily oral administration of saline (control group) or Ob-X at a dose of 0.5 mg/mouse/day (Ob-X group) for 5 weeks. Representative photographs of osmium tetroxide-stained sections of livers (original magnification 200×).

Figure 5.  Effects of Ob-X on serum glucose levels in genetically obese ob/ob mice. Ob/ob mice (n = 8/group) received daily oral administration of saline (control group) or Ob-X at a dose of 0.5 mg/mouse/day (Ob-X group) for 5 weeks. All values are expressed as the mean ± SD. *Significantly different vs. control group, P < 0.05.
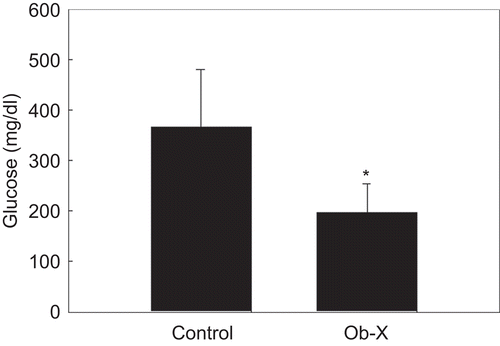
Figure 5.  Effects of Ob-X on serum glucose levels in genetically obese ob/ob mice. Ob/ob mice (n = 8/group) received daily oral administration of saline (control group) or Ob-X at a dose of 0.5 mg/mouse/day (Ob-X group) for 5 weeks. All values are expressed as the mean ± SD. *Significantly different vs. control group, P < 0.05.

Reprints and Corporate Permissions

Please note: Selecting permissions does not provide access to the full text of the article, please see our help page How do I view content?

To request a reprint or corporate permissions for this article, please click on the relevant link below:

Academic Permissions

Please note: Selecting permissions does not provide access to the full text of the article, please see our help page How do I view content?

Obtain permissions instantly via Rightslink by clicking on the button below:

If you are unable to obtain permissions via Rightslink, please complete and submit this Permissions form. For more information, please visit our Permissions help page.