1,593
Views
54
CrossRef citations to date
0
Altmetric
Research Article

Ligustrazine improves atherosclerosis in rat via attenuation of oxidative stress

, , , &
Pages 856-863 | Received 27 Jul 2010, Accepted 30 Dec 2010, Published online: 10 May 2011

Figures & data

Figure 1.  The chemical structure of ligustrazine.

Figure 1.  The chemical structure of ligustrazine.

Table 1.  Blood parameters.

Figure 2.  (A) Representative hematoxylin and eosin (H&E) staining for the thoracic aortas (400× magnification). (B) Quantification of lesion area. (C) mRNA quantification for the antioxidant genes in aorta. Data are expressed as mean ± SEM (for each group, n = 10). ##P < 0.01 compared with control (CTL) rats; *P < 0.05 and **P < 0.01 compared with atherosclerotic (As) rats.
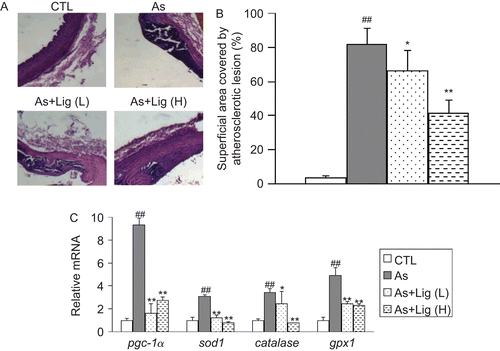
Figure 2.  (A) Representative hematoxylin and eosin (H&E) staining for the thoracic aortas (400× magnification). (B) Quantification of lesion area. (C) mRNA quantification for the antioxidant genes in aorta. Data are expressed as mean ± SEM (for each group, n = 10). ##P < 0.01 compared with control (CTL) rats; *P < 0.05 and **P < 0.01 compared with atherosclerotic (As) rats.
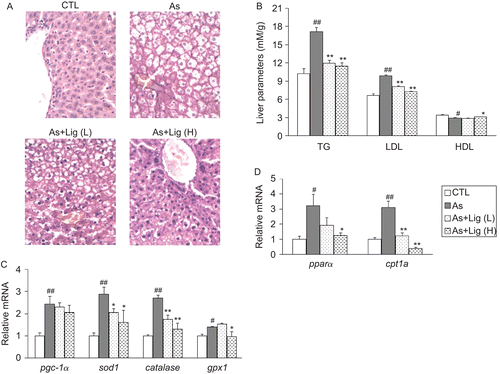
Figure 3.  (A) Representative hematoxylin and eosin (H&E) staining for the livers (400× magnification). (B) Lipid profile in the livers. (C) mRNA quantification for the antioxidant genes. (D) mRNA quantification for the genes in fatty acid oxidation. Data are expressed as mean ± SEM (for each group, n = 10). #P < 0.05 and ##P < 0.01 compared with control (CTL) rats; *P < 0.05 and **P < 0.01 compared with atherosclerotic (As) rats.

Figure 3.  (A) Representative hematoxylin and eosin (H&E) staining for the livers (400× magnification). (B) Lipid profile in the livers. (C) mRNA quantification for the antioxidant genes. (D) mRNA quantification for the genes in fatty acid oxidation. Data are expressed as mean ± SEM (for each group, n = 10). #P < 0.05 and ##P < 0.01 compared with control (CTL) rats; *P < 0.05 and **P < 0.01 compared with atherosclerotic (As) rats.
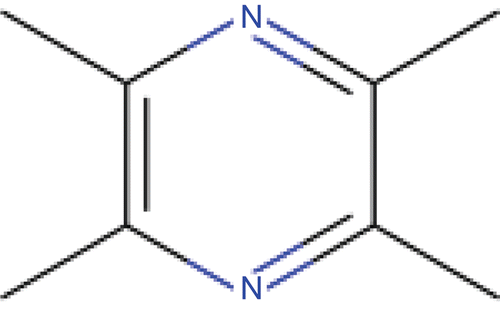
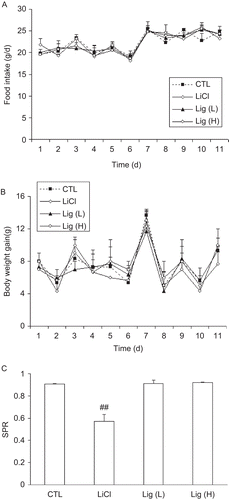
Figure 4.  Daily food intake (A) and body weight gain (B) of normal rats given saline solution or Lig. (C) Effect of Lig treatment on saccharin preference of rats. Data are expressed as mean ± SEM (for each group, n = 6). ##P < 0.01 compared with control (CTL) rats.

Figure 4.  Daily food intake (A) and body weight gain (B) of normal rats given saline solution or Lig. (C) Effect of Lig treatment on saccharin preference of rats. Data are expressed as mean ± SEM (for each group, n = 6). ##P < 0.01 compared with control (CTL) rats.

Reprints and Corporate Permissions

Please note: Selecting permissions does not provide access to the full text of the article, please see our help page How do I view content?

To request a reprint or corporate permissions for this article, please click on the relevant link below:

Academic Permissions

Please note: Selecting permissions does not provide access to the full text of the article, please see our help page How do I view content?

Obtain permissions instantly via Rightslink by clicking on the button below:

If you are unable to obtain permissions via Rightslink, please complete and submit this Permissions form. For more information, please visit our Permissions help page.