858
Views
7
CrossRef citations to date
0
Altmetric
Research Article

Stimulative effects of Polygonum amplexicaule var. sinense on osteoblastic MC3T3-E1 cells

, , &
Pages 1091-1096 | Received 04 Dec 2010, Accepted 28 Feb 2011, Published online: 20 May 2011

Figures & data

Figure 1.  PAF ethanol extracts increase the proliferation of MC3T3-E1 cells. (A) PAF ethanol extracts induced time-dependent cell growth. MC3T3-E1 cells in 96-well plates were cultured with 1 µg/mL PAF extract for 7 days. Cell numbers were measured with a CCK-8 assay. (B) PAF ethanol extracts induced dose-dependent cell growth. Cells in 96-well plates were cultured with indicated ethanol extract for 3 days. Cell numbers were measured by a CCK-8 assay. Each point represents the mean ± SD of five determinations. *P < 0.05, **P < 0.01 compared with controls by Student’s t-test. “EX” means ethanol extracts; “DB” means diethylstilbestrol (as positive control).
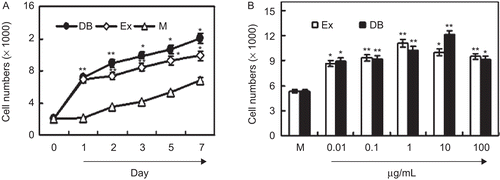
Figure 1.  PAF ethanol extracts increase the proliferation of MC3T3-E1 cells. (A) PAF ethanol extracts induced time-dependent cell growth. MC3T3-E1 cells in 96-well plates were cultured with 1 µg/mL PAF extract for 7 days. Cell numbers were measured with a CCK-8 assay. (B) PAF ethanol extracts induced dose-dependent cell growth. Cells in 96-well plates were cultured with indicated ethanol extract for 3 days. Cell numbers were measured by a CCK-8 assay. Each point represents the mean ± SD of five determinations. *P < 0.05, **P < 0.01 compared with controls by Student’s t-test. “EX” means ethanol extracts; “DB” means diethylstilbestrol (as positive control).

Figure 2.  PAF ethanol extracts promotes cell cycle progression in MC3T3-E1 cells. Cells were seeded in six-well plates and cultured with indicated extract and 1 µg/mL DB for 3 days. Cell cycle was analyzed by PI staining. (A) The profile of cell cycle analysis. (B) The percentage of cells in S-phase. Results were expressed as means ± SD of five determinations. **P < 0.01 compared with controls by Student’s t-test. “DB” means diethylstilbestrol (as positive control).
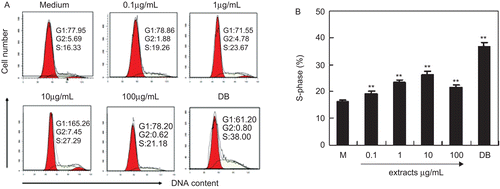
Figure 2.  PAF ethanol extracts promotes cell cycle progression in MC3T3-E1 cells. Cells were seeded in six-well plates and cultured with indicated extract and 1 µg/mL DB for 3 days. Cell cycle was analyzed by PI staining. (A) The profile of cell cycle analysis. (B) The percentage of cells in S-phase. Results were expressed as means ± SD of five determinations. **P < 0.01 compared with controls by Student’s t-test. “DB” means diethylstilbestrol (as positive control).

Figure 3.  The effect of ethanol extracts on alkaline phosphatase (ALP) expression in MC3T3-E1 cells. Cells were cultured with indicated ethanol extracts or DB for 3 days in the presence of 10 mM β-glycerophosphate (β-GP). ALP concentration was detected by ELISA. Results were expressed as means ± SD of five determinations. *P < 0.05, **P < 0.01 compared with controls by Student’s t-test. “EX” means ethanol extracts; “DB” means diethylstilbestrol (as positive control).
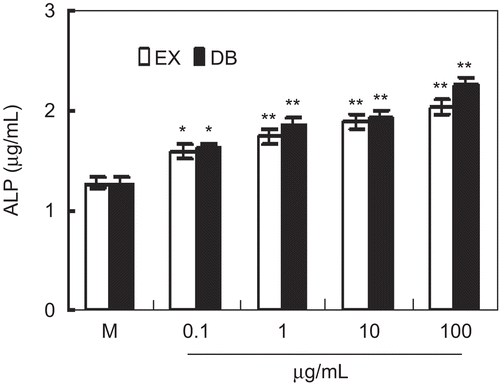
Figure 3.  The effect of ethanol extracts on alkaline phosphatase (ALP) expression in MC3T3-E1 cells. Cells were cultured with indicated ethanol extracts or DB for 3 days in the presence of 10 mM β-glycerophosphate (β-GP). ALP concentration was detected by ELISA. Results were expressed as means ± SD of five determinations. *P < 0.05, **P < 0.01 compared with controls by Student’s t-test. “EX” means ethanol extracts; “DB” means diethylstilbestrol (as positive control).

Figure 4.  The effect of ethanol extracts on prostaglandin E2 (PGE2) production in MC3T3-E1 cells. Cells were cultured with indicated ethanol extracts and 1 µg/mL DB for 3 days in the presence of 10−10 M TNF-α. PGE2 concentration was measured by ELISA. Results were expressed as means ± SD of five determinations. **P < 0.01 compared with control by Student’s t-test. “DB” means diethylstilbestrol (as positive control).
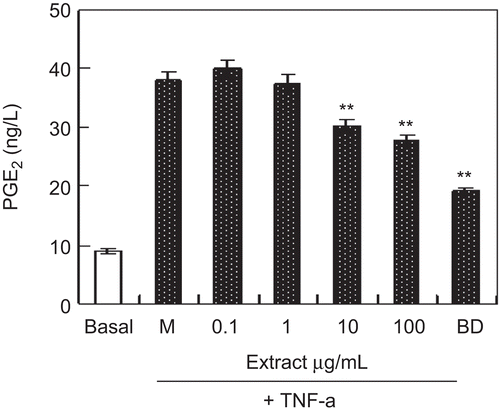
Figure 4.  The effect of ethanol extracts on prostaglandin E2 (PGE2) production in MC3T3-E1 cells. Cells were cultured with indicated ethanol extracts and 1 µg/mL DB for 3 days in the presence of 10−10 M TNF-α. PGE2 concentration was measured by ELISA. Results were expressed as means ± SD of five determinations. **P < 0.01 compared with control by Student’s t-test. “DB” means diethylstilbestrol (as positive control).

Reprints and Corporate Permissions

Please note: Selecting permissions does not provide access to the full text of the article, please see our help page How do I view content?

To request a reprint or corporate permissions for this article, please click on the relevant link below:

Academic Permissions

Please note: Selecting permissions does not provide access to the full text of the article, please see our help page How do I view content?

Obtain permissions instantly via Rightslink by clicking on the button below:

If you are unable to obtain permissions via Rightslink, please complete and submit this Permissions form. For more information, please visit our Permissions help page.