1,186
Views
18
CrossRef citations to date
0
Altmetric
Research Article

Enhancement of in vitro and in vivo anticancer activities of polysaccharide peptide from Grifola frondosa by chemical modifications

, , , , , , , & show all
Pages 1114-1120 | Received 07 Nov 2010, Accepted 03 Mar 2011, Published online: 20 May 2011

Figures & data

Figure 1.  Molecular weight distribution of different forms of MPSP on SDS-PAGE. Lane 1: Low-range marker; lane 2: BSA; lane 3: Phosphorylated MPSP; lane 4: Acetylated MPSP; lane 5: Esterified MPSP; lane 6: Crude MPSP.
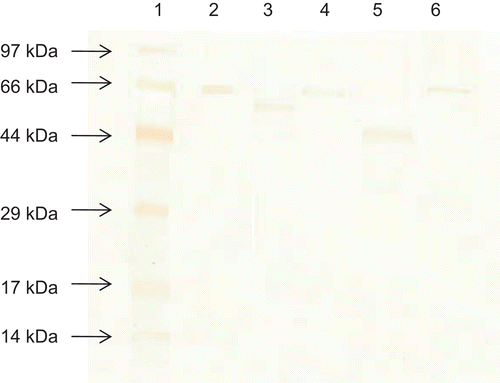
Figure 1.  Molecular weight distribution of different forms of MPSP on SDS-PAGE. Lane 1: Low-range marker; lane 2: BSA; lane 3: Phosphorylated MPSP; lane 4: Acetylated MPSP; lane 5: Esterified MPSP; lane 6: Crude MPSP.

Figure 2.  The changes in serum total sialic acid (TSA) in the Normal, CPA, CPA + CMPSP, CPA + PMPSP, CPA + AMPSP and CPA + EMPSP groups. Data are expressed as means ± SEM, n = 9. #p < 0.05 and ###p < 0.001 represent significant differences when comparing the serum TSA before and after drug treatment in each group. *p < 0.05 represents significant differences when comparing various treatment groups’ post-treatment serum TSA with that of the CPA + CMPSP. NS refers to no significant difference.
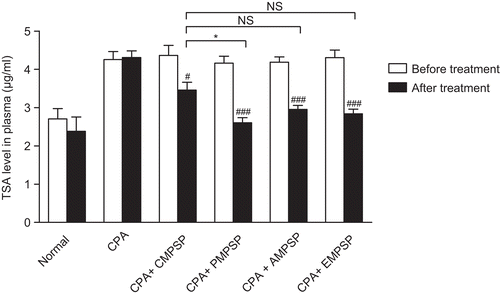
Figure 2.  The changes in serum total sialic acid (TSA) in the Normal, CPA, CPA + CMPSP, CPA + PMPSP, CPA + AMPSP and CPA + EMPSP groups. Data are expressed as means ± SEM, n = 9. #p < 0.05 and ###p < 0.001 represent significant differences when comparing the serum TSA before and after drug treatment in each group. *p < 0.05 represents significant differences when comparing various treatment groups’ post-treatment serum TSA with that of the CPA + CMPSP. NS refers to no significant difference.

Figure 3.  Growth inhibitory effects of crude (A), phosphorylated (B), acetylated (C) and esterified (D) MPSP on C6 and normal brain cells after a 24-h treatment. A graph highlighting the growth inhibitory effects of various forms of MPSP at 100 µg/mL (E). Data are expressed as mean ± SEM, n = 3. *p < 0.05, **p < 0.01, and ***p < 0.001 represent significant differences when comparing with its corresponding concentration in the normal brain cells. #p < 0.05 represents significant differences when comparing the growth inhibitory effects of various forms of MPSP with that of the crude MPSP. NS refers to no significant difference.
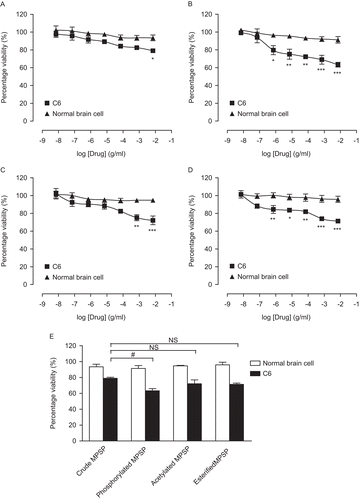
Figure 3.  Growth inhibitory effects of crude (A), phosphorylated (B), acetylated (C) and esterified (D) MPSP on C6 and normal brain cells after a 24-h treatment. A graph highlighting the growth inhibitory effects of various forms of MPSP at 100 µg/mL (E). Data are expressed as mean ± SEM, n = 3. *p < 0.05, **p < 0.01, and ***p < 0.001 represent significant differences when comparing with its corresponding concentration in the normal brain cells. #p < 0.05 represents significant differences when comparing the growth inhibitory effects of various forms of MPSP with that of the crude MPSP. NS refers to no significant difference.

Reprints and Corporate Permissions

Please note: Selecting permissions does not provide access to the full text of the article, please see our help page How do I view content?

To request a reprint or corporate permissions for this article, please click on the relevant link below:

Academic Permissions

Please note: Selecting permissions does not provide access to the full text of the article, please see our help page How do I view content?

Obtain permissions instantly via Rightslink by clicking on the button below:

If you are unable to obtain permissions via Rightslink, please complete and submit this Permissions form. For more information, please visit our Permissions help page.