1,492
Views
20
CrossRef citations to date
0
Altmetric
Research Article

Antioxidant properties of Taraxacum officinale fruit extract are involved in the protective effect against cellular death induced by sodium nitroprusside in brain of rats

, , , , , & show all
Pages 883-891 | Received 14 Jul 2011, Accepted 11 Nov 2011, Published online: 06 Apr 2012

Figures & data

Figure 1.  Protective effect of T. officinale fruit extract on the decrease of cellular viability induced by SNP. Slices of cortex (A), striatum (B) and hippocampus (C) were preincubated with T. officinale fruit extract (1, 5, 10 and 20 µg/mL) or vehicle (EtOH) and SNP (50 µM) for 2 h at 37°C in oxygenated PBS buffer. Cellular viability was evaluated by the MTT reduction method. Results are expressed as the percentage of control (dotted line). # Indicates statistical difference from control group. * Indicates statistical difference from SNP group by one-way ANOVA, followed by Duncan’s post hoc test (p < 0.05). All experiments were performed in duplicate (n = 6).
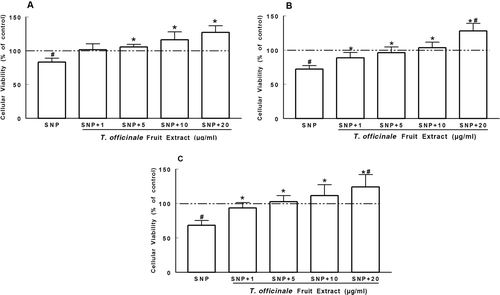
Figure 1.  Protective effect of T. officinale fruit extract on the decrease of cellular viability induced by SNP. Slices of cortex (A), striatum (B) and hippocampus (C) were preincubated with T. officinale fruit extract (1, 5, 10 and 20 µg/mL) or vehicle (EtOH) and SNP (50 µM) for 2 h at 37°C in oxygenated PBS buffer. Cellular viability was evaluated by the MTT reduction method. Results are expressed as the percentage of control (dotted line). # Indicates statistical difference from control group. * Indicates statistical difference from SNP group by one-way ANOVA, followed by Duncan’s post hoc test (p < 0.05). All experiments were performed in duplicate (n = 6).

Figure 2.  Effects of T. officinale fruit extract on SNP-induced lipid peroxidation in whole brain of rats. Brain homogenates were pre-incubated at 37°C for 1h in a buffered medium containing T. officinale fruit extract (1, 5, 10 and 20 μg/mL) or vehicle (EtOH) and SNP (5 µM). Lipid peroxidation was evaluated through measurements of thiobarbituric acid reactive substances (TBARS) production. Results are expressed as percent of control (without SNP and extract). 100% of control corresponds to 3.92 ± 0.37 nmol MDA/g of tissue. # Indicates statistical difference from control group. * Indicates statistical difference from SNP group by one-way ANOVA, followed by Duncan’s post hoc test (p < 0.05). All experiments were performed in duplicate (n = 5).
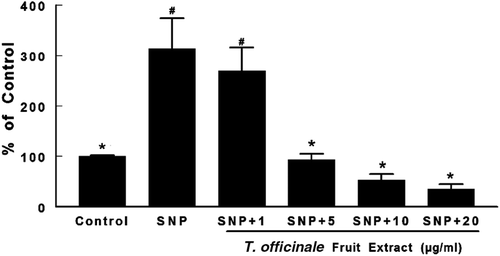
Figure 2.  Effects of T. officinale fruit extract on SNP-induced lipid peroxidation in whole brain of rats. Brain homogenates were pre-incubated at 37°C for 1h in a buffered medium containing T. officinale fruit extract (1, 5, 10 and 20 μg/mL) or vehicle (EtOH) and SNP (5 µM). Lipid peroxidation was evaluated through measurements of thiobarbituric acid reactive substances (TBARS) production. Results are expressed as percent of control (without SNP and extract). 100% of control corresponds to 3.92 ± 0.37 nmol MDA/g of tissue. # Indicates statistical difference from control group. * Indicates statistical difference from SNP group by one-way ANOVA, followed by Duncan’s post hoc test (p < 0.05). All experiments were performed in duplicate (n = 5).
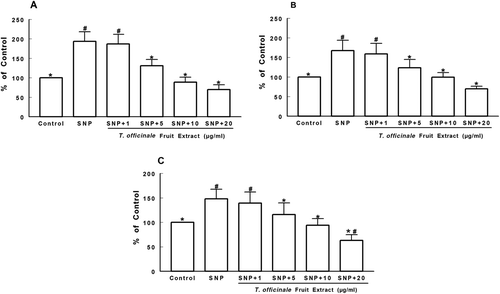
Figure 3  Effects of T. officinale fruit extract on SNP-induced TBARS production in cortex (A), striatum (B) and hippocampus (C) of rats. The homogenates of brain structures were preincubated at 37°C for 1h in a buffered medium containing T. officinale fruit extract (1, 5, 10 and 20 μg/mL) or vehicle (EtOH) and SNP (5 µM). Lipid peroxidation was evaluated through measurements of thiobarbituric acid reactive substances production (TBARS). Results are expressed as percent of control (without SNP and extract). 100% of control corresponds to 1.63 ± 0.21 nmol MDA/g of tissue (A), 1.63 ± 0.34 nmol MDA/g of tissue (B) and 1.58 ± 0.06 nmol MDA/g of tissue (C). # Indicates statistical difference from control group. * Indicates statistical difference from SNP group by one-way ANOVA, followed by Duncan’s post hoc test (p < 0.05). All experiments were performed in duplicate (n = 5).

Figure 3  Effects of T. officinale fruit extract on SNP-induced TBARS production in cortex (A), striatum (B) and hippocampus (C) of rats. The homogenates of brain structures were preincubated at 37°C for 1h in a buffered medium containing T. officinale fruit extract (1, 5, 10 and 20 μg/mL) or vehicle (EtOH) and SNP (5 µM). Lipid peroxidation was evaluated through measurements of thiobarbituric acid reactive substances production (TBARS). Results are expressed as percent of control (without SNP and extract). 100% of control corresponds to 1.63 ± 0.21 nmol MDA/g of tissue (A), 1.63 ± 0.34 nmol MDA/g of tissue (B) and 1.58 ± 0.06 nmol MDA/g of tissue (C). # Indicates statistical difference from control group. * Indicates statistical difference from SNP group by one-way ANOVA, followed by Duncan’s post hoc test (p < 0.05). All experiments were performed in duplicate (n = 5).

Figure 4.  Scavenging activity of T. officinale fruit extract on NO˙ (A) and DPPH˙ (B). For NO˙ analysis, SNP (5 mM) was incubated at 25°C for 120 min with T. officinale fruit extract (1, 5, 10, 20, 50, 75 and 100 µg/mL) or vehicle (EtOH) and NO˙ scavenging activity was determined using the Griess reagent. For DPPH˙ scavenger activity, T. officinale (10, 20, 30, 40, 50, 75 and 100 µg/mL) or vehicle (EtOH) were incubated at room temperature for 30 min and the decrease in the absorbance measured at 518 nm depicted the scavenger activity of the extract against DPPH˙ radical. Results are expressed as percent of inhibition in relation to control without extract. The mean control value is 21.85 ± 1.33 μM of nitrite (A) and 0.904 ± 0.0138 ABS (B). a, b, c and d indicate statistical significance among different concentration of the extracts by one-way ANOVA, followed by Duncan’s post hoc test (p < 0.05). All experiments were performed in duplicate (n = 4).
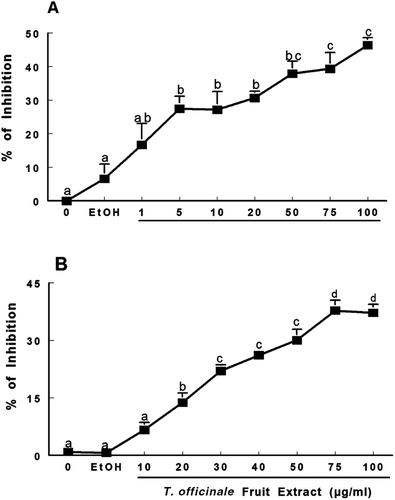
Figure 4.  Scavenging activity of T. officinale fruit extract on NO˙ (A) and DPPH˙ (B). For NO˙ analysis, SNP (5 mM) was incubated at 25°C for 120 min with T. officinale fruit extract (1, 5, 10, 20, 50, 75 and 100 µg/mL) or vehicle (EtOH) and NO˙ scavenging activity was determined using the Griess reagent. For DPPH˙ scavenger activity, T. officinale (10, 20, 30, 40, 50, 75 and 100 µg/mL) or vehicle (EtOH) were incubated at room temperature for 30 min and the decrease in the absorbance measured at 518 nm depicted the scavenger activity of the extract against DPPH˙ radical. Results are expressed as percent of inhibition in relation to control without extract. The mean control value is 21.85 ± 1.33 μM of nitrite (A) and 0.904 ± 0.0138 ABS (B). a, b, c and d indicate statistical significance among different concentration of the extracts by one-way ANOVA, followed by Duncan’s post hoc test (p < 0.05). All experiments were performed in duplicate (n = 4).
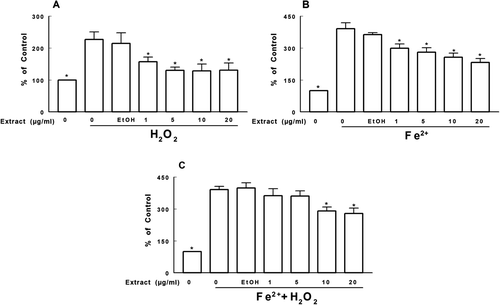
Figure 5.  Effect of T. officinale fruit extract on the deoxyribose oxidation induced by H2O2 (A), Fe2+ (B) and Fe2+ + H2O2 (C). T. officinale fruit extract (1, 5, 10 and 20 μg/mL) or vehicle (EtOH) were incubated with 3 mM deoxyribose, 50 μM FeSO4 and/or 500 μM H2O2 at 37°C for 30 min. Results are expressed as percent of control. The mean control value is 1.065 ± 0.193 nM of MDA/g of deoxyribose. * Indicates a statistically significant difference from H2O2 (A), Fe2+ (B) or Fe2+ + H2O2 (C) by one-way ANOVA, followed by Duncan’s post hoc test (p < 0.05). All experiments were performed in duplicate (n = 4).

Figure 5.  Effect of T. officinale fruit extract on the deoxyribose oxidation induced by H2O2 (A), Fe2+ (B) and Fe2+ + H2O2 (C). T. officinale fruit extract (1, 5, 10 and 20 μg/mL) or vehicle (EtOH) were incubated with 3 mM deoxyribose, 50 μM FeSO4 and/or 500 μM H2O2 at 37°C for 30 min. Results are expressed as percent of control. The mean control value is 1.065 ± 0.193 nM of MDA/g of deoxyribose. * Indicates a statistically significant difference from H2O2 (A), Fe2+ (B) or Fe2+ + H2O2 (C) by one-way ANOVA, followed by Duncan’s post hoc test (p < 0.05). All experiments were performed in duplicate (n = 4).

Figure 6.  Reducing power of T. officinale extract was evaluated by spectrophotometer detection of Fe3+ to Fe 2+ transformation. T. officinale fruit extract (1, 5, 10, 20, 50, 75 and 100 µg/mL) or vehicle (EtOH) were incubated with 150 μM FeCl3, 62.5 μg/mL ortho-phenantroline. The extract reducing power was estimated by an increase in the color reaction at 510 nm when compared to a control in different times, 1 hour (▴); 2 hours (• ); 3 hours (▪); 6 hours (♦) and 24 hours (□). The mean control value is 0.01 ± 0.00051 ABS. All experiments were performed in duplicates (n = 3).
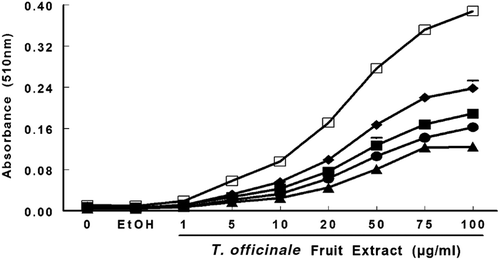
Figure 6.  Reducing power of T. officinale extract was evaluated by spectrophotometer detection of Fe3+ to Fe 2+ transformation. T. officinale fruit extract (1, 5, 10, 20, 50, 75 and 100 µg/mL) or vehicle (EtOH) were incubated with 150 μM FeCl3, 62.5 μg/mL ortho-phenantroline. The extract reducing power was estimated by an increase in the color reaction at 510 nm when compared to a control in different times, 1 hour (▴); 2 hours (• ); 3 hours (▪); 6 hours (♦) and 24 hours (□). The mean control value is 0.01 ± 0.00051 ABS. All experiments were performed in duplicates (n = 3).

Reprints and Corporate Permissions

Please note: Selecting permissions does not provide access to the full text of the article, please see our help page How do I view content?

To request a reprint or corporate permissions for this article, please click on the relevant link below:

Academic Permissions

Please note: Selecting permissions does not provide access to the full text of the article, please see our help page How do I view content?

Obtain permissions instantly via Rightslink by clicking on the button below:

If you are unable to obtain permissions via Rightslink, please complete and submit this Permissions form. For more information, please visit our Permissions help page.