Figures & data
Figure 1. Chemical equilibrium reaction between the lactone (a) and carboxylate (b) forms of CPTs (R=H, CPT; R=OH, HCPT).
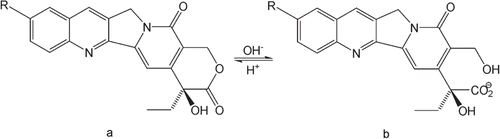
Figure 2. Representative chromatograms of: (A) a blank mouse liver tissue homogenate sample without the first LLE step; (B) a blank mouse liver tissue homogenate sample using the two-step LLE; (C) a blank mouse liver tissue homogenate spiked with HCPT (20 ng/mL) and I.S. (CPT 200 ng/mL); (D) a mouse liver tissue homogenate sample at 4 h after oral administration of HCPT at a dose of 80 mg/kg and spiked with I.S. (CPT 200 ng/mL).
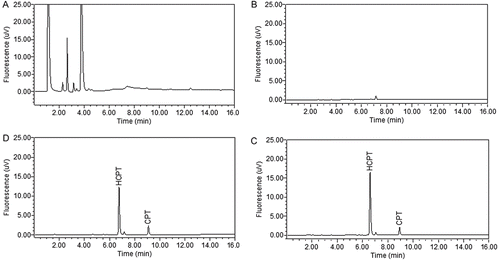
Figure 3. A representative calibration curve of HCPT in liver tissue homogenate samples.
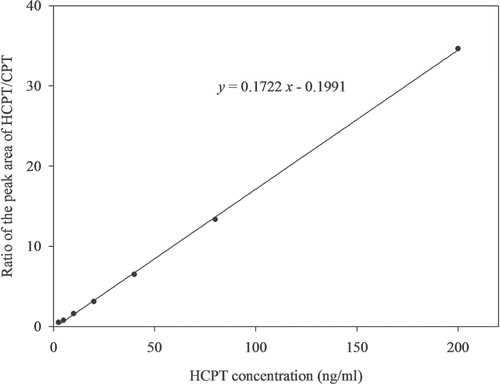
Table 1. Accuracy and precision for the analysis of HCPT in mouse liver tissue homogenates.
Table 2. Stability of HCPT in liver tissue homogenate samples (n = 6).
Table 3. The pharmacokinetic parameters of HCPT after oral administration of 80 mg/kg of HCPT.
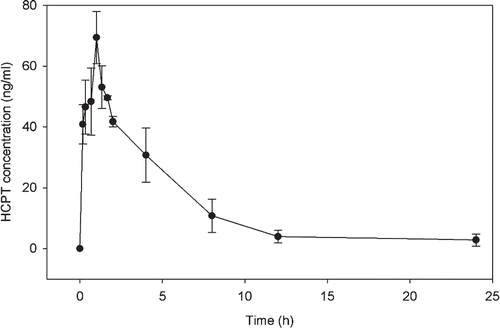
Figure 4. Mean concentration-time profiles of HCPT in mouse liver tissue homogenate samples from four subjects each receiving a single dose of 80 mg/kg HCPT.