825
Views
17
CrossRef citations to date
0
Altmetric
Research Article

Involvement of intrinsic mitochondrial pathway in neosergeolide-induced apoptosis of human HL-60 leukemia cells: The role of mitochondrial permeability transition pore and DNA damage

, , , , , , , , & show all
Pages 980-993 | Received 15 Sep 2011, Accepted 01 Jan 2012, Published online: 09 Jul 2012

Figures & data

Figure 1.  Chemical structure of neosergeolide (A), concentration-response curve of neosergeolide cytotoxicity (%) after 24 h exposure of HL-60 and PBMC (B), and its effects on 5-bromo-2-deoxyuridine (BrdU) incorporation (C) by HL-60 cells. *p < 0.001 compared to control by ANOVA followed by Student Newman–Keuls test. Data are presented as means ± S.E.M. for three independent experiments in triplicate.
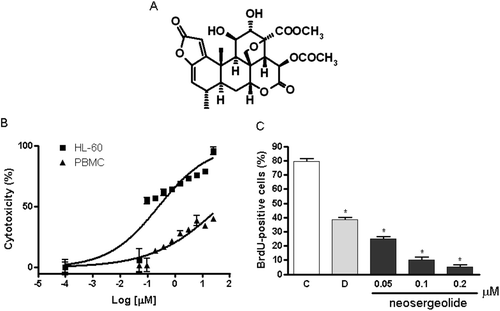
Figure 1.  Chemical structure of neosergeolide (A), concentration-response curve of neosergeolide cytotoxicity (%) after 24 h exposure of HL-60 and PBMC (B), and its effects on 5-bromo-2-deoxyuridine (BrdU) incorporation (C) by HL-60 cells. *p < 0.001 compared to control by ANOVA followed by Student Newman–Keuls test. Data are presented as means ± S.E.M. for three independent experiments in triplicate.

Figure 2.  Morphological features induced by neosergeolide. Microscopic analysis of untreated (A) and neosergeolide-treated HL-60 cells (C-0.05 µM, D-0.1 µM and E-0.2 µM). Doxorubicin (0.6 µM) was used as positive control (B). Cells were incubated for 24 h and stained by May-Grünwald-Giemsa. Black arrows: nuclei pyknotic and nuclear fragmentation, white dashed arrows: debris, and black dashed arrow: membrane damage. Magnification: 400×.
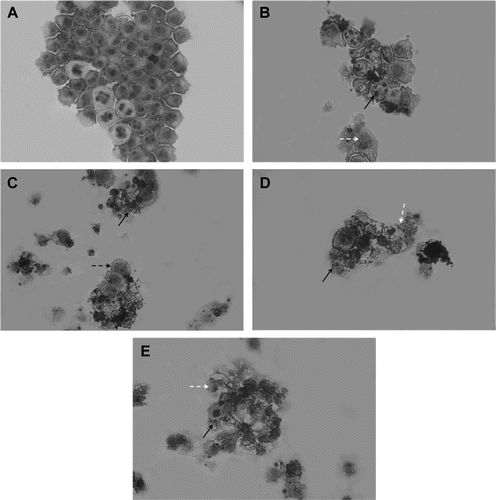
Figure 2.  Morphological features induced by neosergeolide. Microscopic analysis of untreated (A) and neosergeolide-treated HL-60 cells (C-0.05 µM, D-0.1 µM and E-0.2 µM). Doxorubicin (0.6 µM) was used as positive control (B). Cells were incubated for 24 h and stained by May-Grünwald-Giemsa. Black arrows: nuclei pyknotic and nuclear fragmentation, white dashed arrows: debris, and black dashed arrow: membrane damage. Magnification: 400×.

Figure 3.  Effect of neosergeolide on HL-60 cell membrane integrity (A), proliferation (B), internucleosomal DNA fragmentation (C), and mitochondrial transmembrane potential (D), determined by flow cytometric analysis after 3, 6, 12, and 24 h of incubation. The vehicle (0.1% DMSO) used for diluting the test substance was used as negative control. Doxorubicin at 0.6 µM was used as positive control. A total of 5,000 events were analyzed in each experiment. *p < 0.001; **p < 0.05 compared to control by ANOVA followed by Newman–Keuls test. Data are presented as mean values ± S.E.M. from three independent experiments in triplicate.
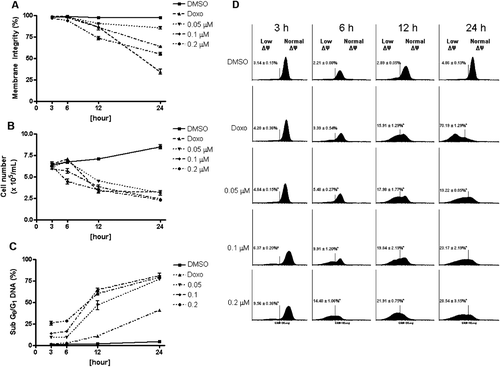
Figure 3.  Effect of neosergeolide on HL-60 cell membrane integrity (A), proliferation (B), internucleosomal DNA fragmentation (C), and mitochondrial transmembrane potential (D), determined by flow cytometric analysis after 3, 6, 12, and 24 h of incubation. The vehicle (0.1% DMSO) used for diluting the test substance was used as negative control. Doxorubicin at 0.6 µM was used as positive control. A total of 5,000 events were analyzed in each experiment. *p < 0.001; **p < 0.05 compared to control by ANOVA followed by Newman–Keuls test. Data are presented as mean values ± S.E.M. from three independent experiments in triplicate.

Figure 4.  Effect of neosergeolide after 3 h exposure in the presence or absence of CsA (5 µM) on HL-60 mitochondrial transmembrane potential (A), internucleosomal DNA fragmentation (B), percentage of cells with active caspase-9 (C), and caspases-3 and -7 (D) determined by flow cytometric analysis.
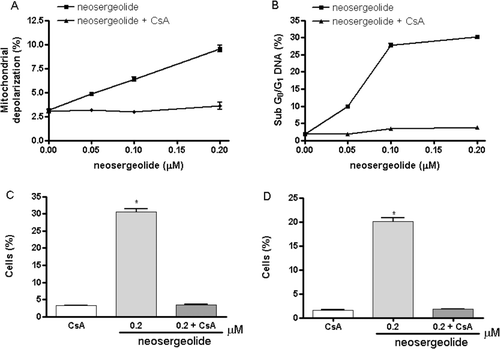
Figure 4.  Effect of neosergeolide after 3 h exposure in the presence or absence of CsA (5 µM) on HL-60 mitochondrial transmembrane potential (A), internucleosomal DNA fragmentation (B), percentage of cells with active caspase-9 (C), and caspases-3 and -7 (D) determined by flow cytometric analysis.

Figure 5.  Effect on PS externalization after HL-60 cells treated with 0.05 (C), 0.1 (D) and 0.2 µM (E) neosergeolide. The PS externalization was determined by flow cytometry using AnnV-FITC (YLW-HLog) and PI (RED-HLog) after pulse treatment (3 h of neosergeolide exposure following 21 h reincubation period without drug). Viable cells are plotted at lower left quadrant, cells in early and late apoptosis with PS externalized are plotted at lower right and upper right quadrants, respectively, and necrotic cells are plotted at upper left quadrant. Negative control (A) was treated with the vehicle (0.1% DMSO) used for diluting the test substance. Doxorubicin (B) at 0.6 µM was used as positive control. A total of 5,000 events were analyzed in each experiment. *p < 0.05 compared to control by ANOVA followed by Newman–Keuls test. Data are presented as mean values ± S.E.M. from two independent experiments in triplicate.
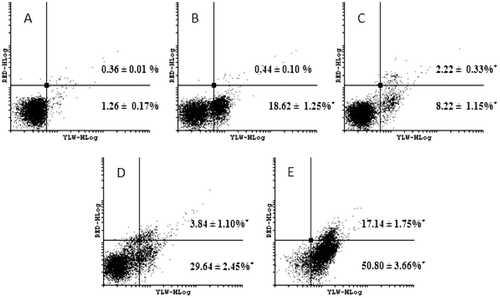
Figure 5.  Effect on PS externalization after HL-60 cells treated with 0.05 (C), 0.1 (D) and 0.2 µM (E) neosergeolide. The PS externalization was determined by flow cytometry using AnnV-FITC (YLW-HLog) and PI (RED-HLog) after pulse treatment (3 h of neosergeolide exposure following 21 h reincubation period without drug). Viable cells are plotted at lower left quadrant, cells in early and late apoptosis with PS externalized are plotted at lower right and upper right quadrants, respectively, and necrotic cells are plotted at upper left quadrant. Negative control (A) was treated with the vehicle (0.1% DMSO) used for diluting the test substance. Doxorubicin (B) at 0.6 µM was used as positive control. A total of 5,000 events were analyzed in each experiment. *p < 0.05 compared to control by ANOVA followed by Newman–Keuls test. Data are presented as mean values ± S.E.M. from two independent experiments in triplicate.
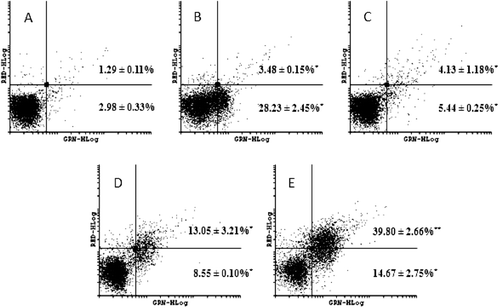
Figure 6.  Effect on caspases-3 and -7 activation after HL-60 cells treated with 0.05 (C), 0.1 (D) and 0.2 µM (E) neosergeolide. Caspases activity was determined by flow cytometry using PI (RED-HLog) and fluorescent-labeled inhibitor of caspases, FLICATM (GRN-HLog) after pulse treatment (3 h of neosergeolide exposure following 21 h reincubation period without drug). Viable cells are plotted at lower left quadrant, cells in early and late apoptosis with active caspases-3 and -7 are plotted at lower right and upper right quadrants, respectively, and necrotic cells are plotted at upper left quadrant. Negative control (A) was treated with the vehicle (0.1% DMSO) used for diluting the test substance. Doxorubicin (B) at 0.6 µM was used as positive control. A total of 5,000 events were analyzed in each experiment. *p < 0.001; **p < 0.05 compared to control by ANOVA followed by Newman–Keuls test. Data are presented as mean values ± S.E.M. from two independent experiments in triplicate.

Figure 6.  Effect on caspases-3 and -7 activation after HL-60 cells treated with 0.05 (C), 0.1 (D) and 0.2 µM (E) neosergeolide. Caspases activity was determined by flow cytometry using PI (RED-HLog) and fluorescent-labeled inhibitor of caspases, FLICATM (GRN-HLog) after pulse treatment (3 h of neosergeolide exposure following 21 h reincubation period without drug). Viable cells are plotted at lower left quadrant, cells in early and late apoptosis with active caspases-3 and -7 are plotted at lower right and upper right quadrants, respectively, and necrotic cells are plotted at upper left quadrant. Negative control (A) was treated with the vehicle (0.1% DMSO) used for diluting the test substance. Doxorubicin (B) at 0.6 µM was used as positive control. A total of 5,000 events were analyzed in each experiment. *p < 0.001; **p < 0.05 compared to control by ANOVA followed by Newman–Keuls test. Data are presented as mean values ± S.E.M. from two independent experiments in triplicate.

Table 1.  Effect of neosergeolide on cell cycle distribution in HL60 cells by flow cytometric using PI after 3 h pulse treatment.

Table 2.  Effect of neosergeolide on HL-60 and PBMC micronucleated cell (MN) frequency in the micronucleus test after 3 h pulse treatment.

Figure 7.  Effects of neosergeolide after 3 h pulse treatment on the distribution of damaged cells in alkaline comet assay into damage grades (G; grades 0–4) on HL-60 (A) and PBMC (B), its effects on HL-60 (C), and PBMC (D) DNA damage index. Bars represent the mean ± S.E.M. of three independent experiments. Negative control (C): cells were treated with the vehicle used for diluting the tested substance. Doxorubicin (0.6 µM) was used as positive control (D). *p < 0.001 compared to control by ANOVA followed by Newman–Keuls test.
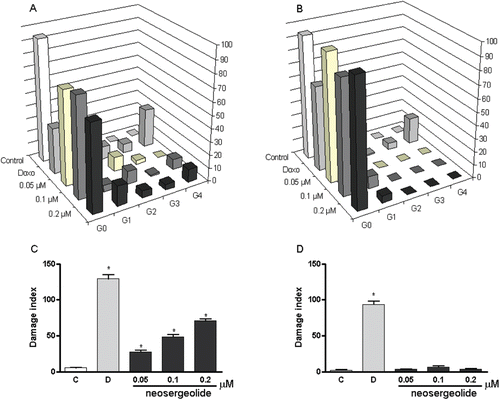
Figure 7.  Effects of neosergeolide after 3 h pulse treatment on the distribution of damaged cells in alkaline comet assay into damage grades (G; grades 0–4) on HL-60 (A) and PBMC (B), its effects on HL-60 (C), and PBMC (D) DNA damage index. Bars represent the mean ± S.E.M. of three independent experiments. Negative control (C): cells were treated with the vehicle used for diluting the tested substance. Doxorubicin (0.6 µM) was used as positive control (D). *p < 0.001 compared to control by ANOVA followed by Newman–Keuls test.

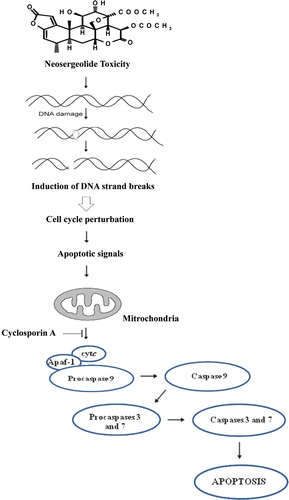
Figure 8.  Summarized model of neosergeolide antiproliferative effects.

Figure 8.  Summarized model of neosergeolide antiproliferative effects.

Reprints and Corporate Permissions

Please note: Selecting permissions does not provide access to the full text of the article, please see our help page How do I view content?

To request a reprint or corporate permissions for this article, please click on the relevant link below:

Academic Permissions

Please note: Selecting permissions does not provide access to the full text of the article, please see our help page How do I view content?

Obtain permissions instantly via Rightslink by clicking on the button below:

If you are unable to obtain permissions via Rightslink, please complete and submit this Permissions form. For more information, please visit our Permissions help page.