Figures & data
Figure 1. Chemical structure of berberine.
Figure 2. Fasting blood glucose profile. The tail vein blood of all mice was collected before and weekly for 2 weeks after the treatment of streptozotocin (STZ) to determine fasting blood glucose level using a glucometer.
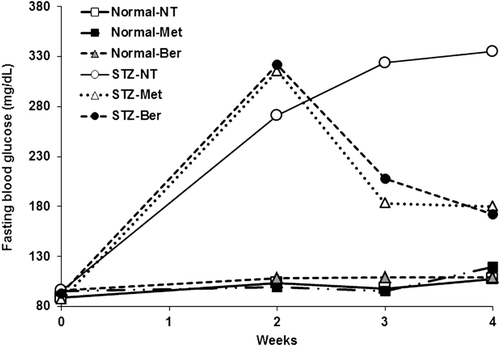
Figure 3. Expression of glutathione peroxidase (GPx), copper zinc superoxide dismutase (CuZn-SOD), and manganese superoxide dismutase (Mn-SOD) messenger RNA (mRNA) in mouse liver. Both normal and diabetic mice were daily intragastrically given metformin (Met) (100 mg/kg/d), berberine (Ber) (200 mg/kg/d), or phosphate-buffer saline, respectively, for 2 weeks. Mice were decapitated 24 h after the last treatment and liver was immediately excised to prepare total RNA. Semi-quantitative determination of mRNA expression was performed using a pairs of primers specific to the investigated genes as described. The data are presented as the mean ± standard deviation (n = 5) from triplicate independent experiments. A significant difference was determined by one-way analysis of variance followed by Tukey post-hoc test. *p < 0.01, **p < 0.001 versus nontreatment (NT).
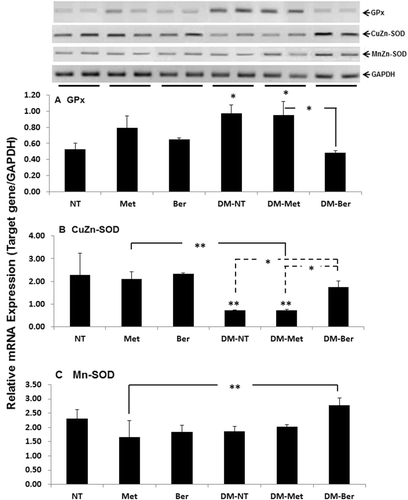
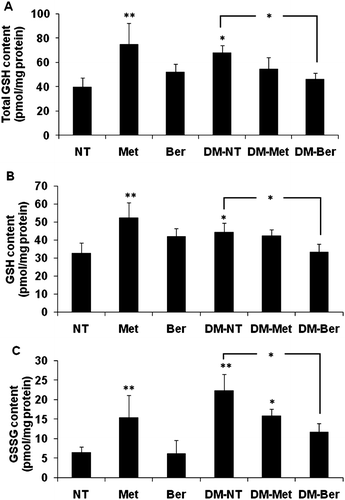
Figure 4. Total glutathione (GSH), reduced glutathione (GSH), and oxidized glutathione (GSSG) contents in mouse liver. Both normal and diabetic mice were daily intragastrically given metformin (Met) (100 mg/kg/d), berberine (Ber) (200 mg/kg/d), or phosphate-buffer saline, respectively, for 2 weeks. Mice were decapitated 24 h after the last treatment and liver was immediately excised to prepare liver homogenate. Levels of total and oxidized/reduced glutathione (GSH/GSSG) contents in mouse livers were determined using the HT glutathione assay kit. The data are presented as the mean ± standard deviation (n = 5) from duplicate independent experiments. A significant difference was determined by one-way analysis of variance followed by Tukey post-hoc test. *p < 0.05, **p < 0.001 versus nontreatment (NT).