Figures & data
Figure 1. Peak 1: 13.30 min retention time matches the chlorogenic acid standard, peak 2: 15.05 min retention time matches the vanillic acid standard, peak 3: 17.10 min retention time matches the caffeic acid standard, peak 4: 22.08 min retention time was identified as vicenin-2, peak 5: 25.29 min retention time matches the p-coumaric acid 2 standard, peak 6: 25.62 min retention time matches the ferulic acid standard, peak 7: 28.99 min retention time matches the vitexin standard and peak 8: 34.56 min retention time matches the isovitexin standard. The chromatograms of standard compounds are also shown in the figure.
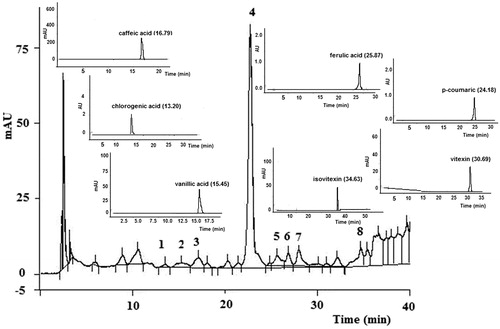
Table 1. Pentobarbital- or midazolam-induced sleep in mice.
Figure 2. Effects of the ethanolic extract of U. circularis on crossed lines (A), grooming activity (B), and number of rearing (D) on the open field paradigm and the head dipping in hole-board test (C). Each value represents the mean ± SEM of results from six mice. Statistical differences were determined by Dunnett’s test *p < 0.05, **p < 0.01 versus control group and #p < 0.05 versus 100 mg/kg U. circularis.
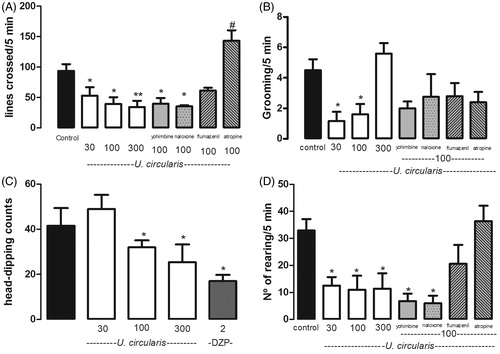
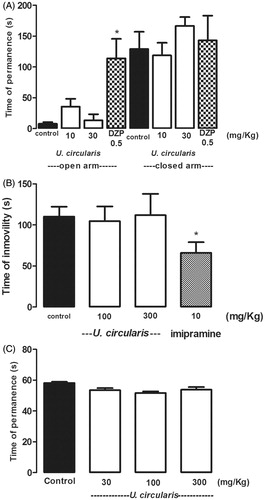
Figure 3. Effects of the ethanolic extract of U. circularis on EPM test (A), forced swimming test (B) and rota-rod test (C). DZP (0.5 mg/kg) and imipramine (10 mg/kg) were used as reference drugs in EPM and forced swimming test, respectively. Each value represents the mean ± SEM of results from six mice. Statistical differences were determined by Dunnett’s test *p < 0.05 versus control group.