Figures & data
Figure 1. Tephrosia sinapou ethyl acetate extract inhibited carrageenin (pre-treatment) and CFA (post-treatment)-induced mechanical hyperalgesia. Panel A: mice were treated with T. sinapou (30–300 mg/kg, 30 min), morphine (5 mg/kg, i.p. 30 min) or vehicle before the carrageenin injection (100 µg/paw). The intensity of mechanical hyperalgesia was measured 1–5 h after carrageenin injection by the electronic pressure-meter test. Panel B: mice received CFA injection (10 µl/paw) or saline (same volume). After 48 h, mechanical hyperalgesia was determined and at 48.5 h mice were treated with T. sinapou (100 mg/kg, i.p.), morphine (5 mg/kg, i.p.) or vehicle. The intensity of mechanical hyperalgesia was measured 48–72 h after CFA injection by the electronic pressure-meter test. Results are presented as means ± SEM of experiments performed with five mice per group and are representative of two separated experiments. *p < 0.05 compared to the carrageenin (Panel A) or CFA (Panel B) + vehicle group, #p < 0.05 compared to the carrageenin + vehicle group and the dose of 30 mg/kg of extract (one-way ANOVA followed by Tukey’s test).
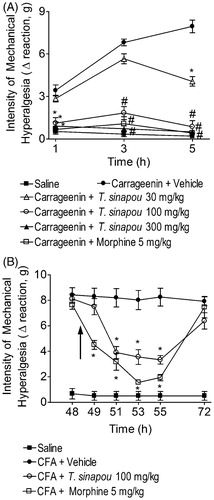
Figure 2. Tephrosia sinapou ethyl acetate extract inhibited carrageenin-induced mechanical and thermal hyperalgesia in an opioid receptor-dependent manner. Mice were treated with naloxone (0.1–1 mg/kg, s.c., 1 h) before T. sinapou (100 mg/kg, i.p.), morphine (5 mg/kg, i.p.) or vehicle. After additional 30 min, mice received carrageenin injection (100 µg/paw). The intensity of mechanical (Panel A) and thermal (Panel B) hyperalgesia were measured 3 (open bars) and 5 (closed bars) h after carrageenin injection by the electronic pressure-meter and hot-plate test. Results are presented as means ± SEM of experiments performed with five mice per group and are representative of two separated experiments. *p < 0.05 compared to the carrageenin positive control vehicle group, #p < 0.05 compared to the naloxone negative control group and fp < 0.05 compared to the naloxone negative control group and the dose of 0.1 mg/kg of naloxone (one-way ANOVA followed by Tukey’s test).
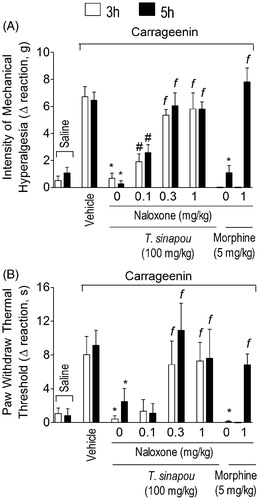
Figure 3. Tephrosia sinapou ethyl acetate extract inhibited neutrophil recruitment (myeloperoxidase activity) by an opioid-dependent mechanism. Panel A: mice were treated with vehicle or T. sinapou (100 mg/kg, i.p.) 30 min before carrageenin (100 µg/paw) stimulus. Panel B: mice were treated with naloxone (0.1–1 mg/kg, s.c., 1 h) before T. sinapou (100 mg/kg, i.p.), morphine (5 mg/kg, i.p.) or vehicle. After additional 30 min, mice received carrageenin injection (100 µg/paw). The neutrophil recruitment was evaluated by the myeloperoxidase activity at 1, 3 and 5 h (Panel A) and at 5 h (Panel B) after carrageenin injection using a kinetic colorimetric assay. Results are presented as means ± SEM of experiments performed with five mice per group and are representative of two separated experiments. *p < 0.05 compared to the carrageenin positive control vehicle group, #p < 0.05 compared to the naloxone negative control group (one-way ANOVA followed by Tukey’s test).
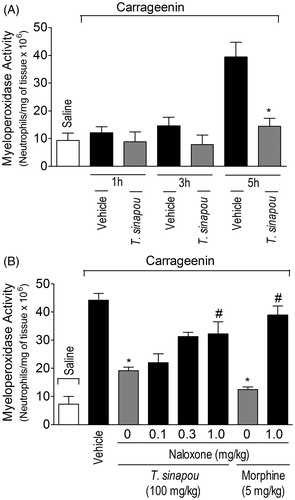
Figure 4. Tephrosia sinapou ethyl acetate extract inhibited carrageenin-induced TNFα production in the paw skin by an opioid-dependent mechanism. Panel A: mice were treated with vehicle or T. sinapou (100 mg/kg, i.p.) 30 min before carrageenin (100 µg/paw) stimulus. Panel B: mice were treated with naloxone (1 mg/kg, s.c., 1 h) before T. sinapou (100 mg/kg, i.p.), morphine (5 mg/kg, i.p.) or vehicle treatment. After additional 30 min, mice received carrageenin (100 µg/paw) stimulus. Paw skin samples were collected 1, 3 and 5 h (Panel A) and at 3 h (Panel B) after carrageenin injection, and TNFα levels were determined by ELISA. Results are presented as means ± SEM of experiments performed with five mice per group and are representative of two separated experiments. *p < 0.05 compared to carrageenin + vehicle group, #p < 0.05 compared to the naloxone negative control group (one-way ANOVA followed by Tukey’s test).
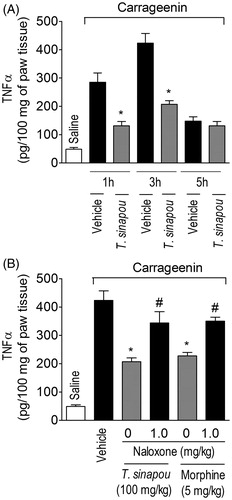
Figure 5. Tephrosia sinapou ethyl acetate extract inhibited carrageenin-induced IL-1β production by an opioid-dependent mechanism. Panel A: mice were treated with vehicle or T. sinapou (100 mg/kg, i.p.) 30 min before carrageenin (100 µg/paw) stimulus. Panel B: mice were treated with naloxone (1 mg/kg, s.c., 1 h) before T. sinapou (100 mg/kg, i.p.), morphine (5 mg/kg, i.p.) or vehicle. After additional 30 min, mice received carrageenin (100 µg/paw) stimulus. Paw skin samples were collected 1, 3 and 5 h (Panel A) and at 3 h (Panel B) after carrageenin injection, and IL-1β levels were determined by ELISA. Results are presented as means ± SEM of experiments performed with five mice per group and are representative of two separated experiments. *p < 0.05 compared to carrageenin + vehicle group, #p < 0.05 compared to the naloxone negative control group (one-way ANOVA followed by Tukey’s test).
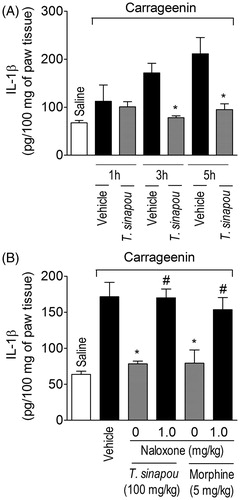
Figure 6. Tephrosia sinapou ethyl acetate extract inhibited PGE2-induced mechanical hyperalgesia and increased the thermal nociceptive threshold of naïve mice in the hot-plate test by an opioid-dependent mechanism. Panel A: mice were treated with T. sinapou (100 mg/kg, i.p.), morphine (5 mg/kg, i.p.) or vehicle. Another group was treated with naloxone (1 mg/kg, s.c., 1 h) before T. sinapou (100 mg/kg, i.p.). After additional 30 min, mice received PGE2 injection (100 ng/paw). The intensity of mechanical hyperalgesia was measured 1–5 h after PGE2 injection by the electronic pressure-meter test. Panel B: mice were treated with T. sinapou (100 mg/kg, i.p.), morphine (5 mg/kg, i.p.) or vehicle. Another group was treated with naloxone (1 mg/kg, s.c., 1 h) before T. sinapou (100 mg/kg, i.p.). The intensity of thermal hyperalgesia was measured 0.5–5 h after treatment using a hot plate. Results are presented as means ± SEM of experiments performed with five mice per group and are representative of two separated experiments. *p < 0.05 compared to the PGE2 + vehicle group (Panel A) or vehicle group (Panel B), #p < 0.05 compared to the T. sinapou group (one-way ANOVA followed by Tukey’s test).
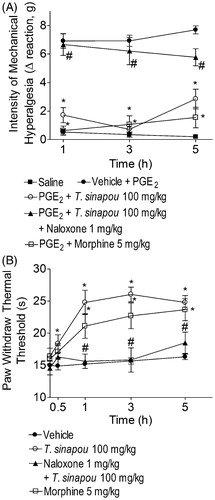
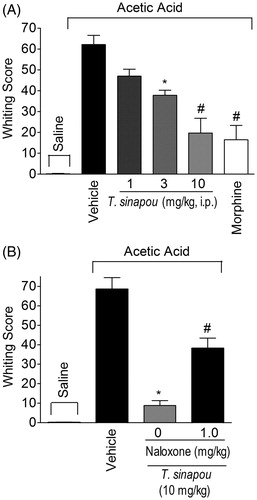
Figure 7. Tephrosia sinapou ethyl acetate extract inhibited acetic acid-induced writhing response in mice by an opioid-dependent mechanism. Panel A: mice were treated i.p. with T. sinapou ethyl acetate extract (1–10 mg/kg, 30 min), morphine (5 mg/kg, i.p., 30 min) or vehicle before i.p. stimulus with acetic acid (0.8% diluted in saline). Panel B: mice were treated with T. sinapou (10 mg/kg, i.p., 30 min) or vehicle and another group was treated with naloxone (1 mg/kg, s.c., 1 h) before T. sinapou (10 mg/kg, i.p., 30 min) before i.p. stimulus with acetic acid (0.8% diluted in saline). The writhing score was evaluated during 20 min after stimulus injection. Results are presented as means ± SEM of experiments performed with five mice per group and are representative of two separated experiments. *p < 0.05 compared to the vehicle group, #p < 0.05 compared to the vehicle group, the dose of 1 mg/kg (Panel A) and compared to the naloxone negative control group (Panel B; one-way ANOVA followed by Tukey’s test).