Figures & data
Table 1. Set of specific genes primer.
Figure 1. (A) Dose selection: The effect of varying concentrations of HEAM (50, 100, 200, 400 mg/kg body weight) and MNU on body weight of Balb/c mice were compared to control (PBS) during an 8-week period. A total of 100 mg/kg body weight dose was found suitable and was therefore retained for subsequent studies. (B) Effect of HEAM (100 mg/kg body weight) and MNU on body weight increase of balb/c mice Aegle Marmelos compared to control (PBS) for period of 28 weeks.
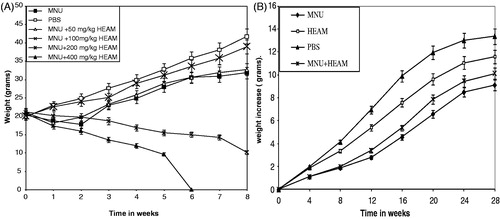
Figure 2. Cell viability assay (MTT) following HEAM treatment on human prostate cancer cell line (DU 145). Values are mean ± SEM. *p < 0.05 considered statistically significant.
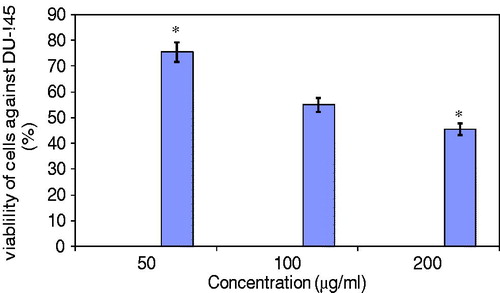
Figure 3. (A) DNA fragmentation in the presence of MNU and HEAM (100 mg/kg b.w.) on agarose gel. (B) HEAM effect on DNA fragmentation: HEAM and MNU + Extract-treated samples show nuclear fragmentation (Lane1: N-Methyl N-nitrosourea; Lane 2: Phosphate buffer saline (PBS); Lane 3: HEAM extract; Lane 4: (MNU + HEAM).
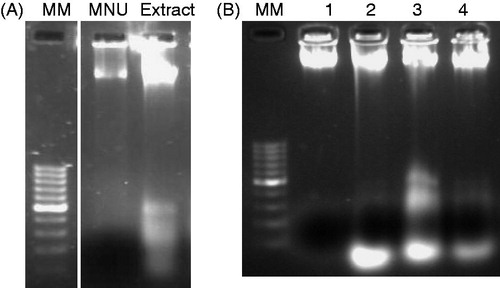
Figure 4. (A) Effect of HEAM on the mRNA level of tumor related genes (p53, Bcl-2), inflammatory (IL-1β, IL-6 and c-jun) and anti-inflammatory (IL-4) cytokines. Representative photographs of ethidium-bromide-stained 2% agarose gels for each gene after 7 months of treatment. (B) Expression of tumor-related genes (p53, Bcl-2), inflammatory (IL-1β, IL-6 and c-jun) and anti-inflammatory (IL-4) cytokines (quantified in terms of fold change according to densitometric analysis). Each experiment was repeated three times with similar results and results are expressed as means ± SE, p < 0.05. Lane 1: MNU, Lane 2: HEAM (100 mg/kg b.w.), Lane 3: Control (PBS), Lane 4: MNU + HEAM (100 mg/kg b.w.).
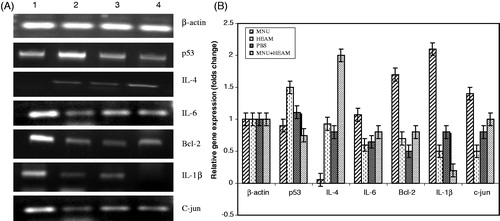
Table 2. Whole blood cell counts in Group I (PBS), Group II (MNU), Group III (HEAM) and Group IV (MNU + HEAM).
Table 3. Leucocyte differential counts in Group I (PBS), Group II (MNU), Group III (HEAM) and Group IV (MNU + HEAM).
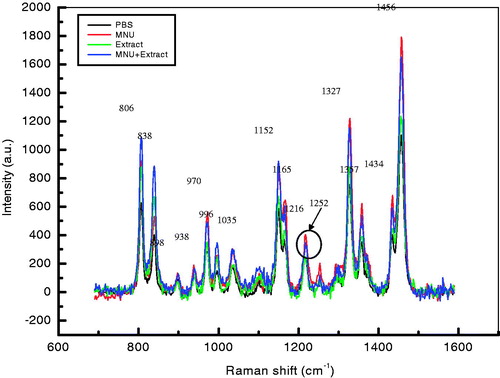
Figure 5. Raman spectra for all the experimental groups. Comparison of Raman laser spectra of DNA in the region 600–1600 cm−1. These spectra are representative of experiments repeated eight times. Raman conditions and parameters: resolution cm−1, laser power 5 mW exciting source was 514.5 nm Argon ion laser.
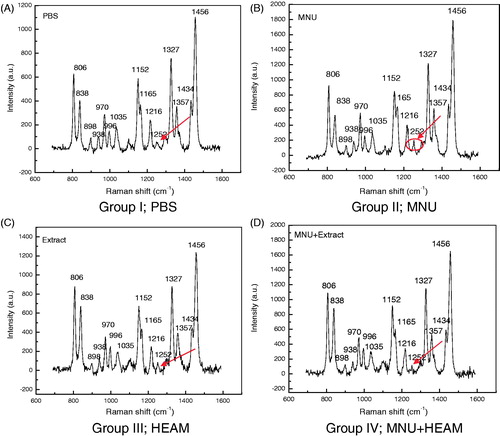
Table 4. Raman bands observed in the spectra of the experimental group treated DNA of liver of Balb/c mice and their tentative assignments with references of earlier reports.
Figure 6. Overlay Raman spectra of DNA samples from Groups I–IV mice. Raman bands at 806, 838, 938, 970, 996, 1035, 1152, 1165, 1216, 1252, 1327, 1357, 1434 and 1456 cm−1 are highlighted. The increase in intensity is observed in MNU (group II)-treated samples followed by MNU + Extract (Group IV)-treated samples while the control (PBS: group I) and Extract (group III)-treated samples had reduced peak intensities for the assigned bands. The major peak alteration is observed at 1252 cm−1 and is characteristic of MNU-treated samples only.