Figures & data
Figure 1. The chemical structures of investigated compounds.
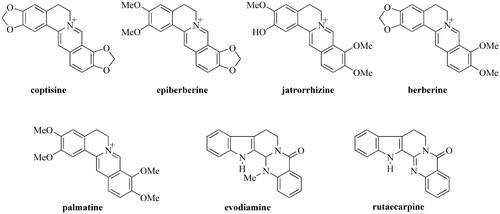
Figure 2. Chromatograms of the sample (S9) under different mobile phase compositions and gradients. (a) System I: H2O (50 mM NaOAc-0.25% HOAc, pH 5.09) (A)–MeCN (B): 0–120 min 0–90% B. (b) System II: H2O (0.1% HCOOH) (A)–MeCN (0.1% HCOOH) (B): 0–15 min, 11–13% B; 15–70 min, 15% B; 70–80 min, 50% B; 80–120 min, 50–100% B. (c) System III: H2O (0.1% HCOOH) (A)–MeOH (B): 0–5 min, 5–8% B; 5–10 min, 8–15% B; 10–35 min, 15–20% B; 35–55 min, 20–30% B; 55–65 min, 30–50% B; 65–80 min, 50–95% B. (d) System IV: H2O (0.1% HCOOH) (A)–MeCN (B): 0–15 min, 13% B; 15–25 min, 13–28% B; 25–30 min, 28–40% B; 40–65 min, 50–65% B; 55–60 min, 65–80% B. (e) System V: H2O (0.1% HCOOH, adjusted to pH 4.0 by ammonia) (A)–MeOH (B): 0–13 min, 5–25% B; 15–25 min, 25–23% B; 23–38 min, 23–38% B; 38–48 min, 38–65% B; 48–70 min, 65–90% B. (f) System VII: H2O (0.3% HCOOH, adjusted to pH 9.9 by ammonia) (A)–MeCN (B): 0–7 min, 5–10% B; 7–12 min, 10–26% B; 12–28 min, 26–31% B; 28–34 min, 31–50% B; 34–40 min, 31–50% B; 40–55 min, 45–65% B; 55–60 min, 65–75% B; 60–70 min, 75–90% B.
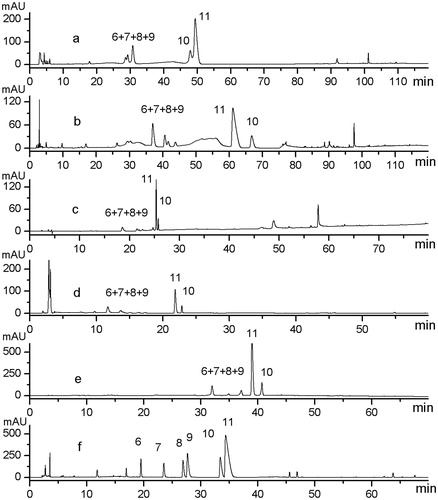
Figure 3. Comparison of representative HPLC fingerprint profiles of mixed standards and the extract of sample and single herb samples under optimized conditions. (a) Extract of Sample S9 (C2–E2), (b) Extract of NC sample (C2), (c) Extract of NC sample (E2), and (d) Mixed standards of the seven chemical constituents. Among 20 representative general peaks, Peaks 1–11 originated from Coptidis Rhizoma, and Peaks 12–20 originated from the Euodiae Fructus. Peaks 6, 8, 9, 10, 11, 12, and 13 are jatrorrhizine, epiberberine, coptisine, palmatine, berberine, evodiamine, and rutaecarpine, respectively.
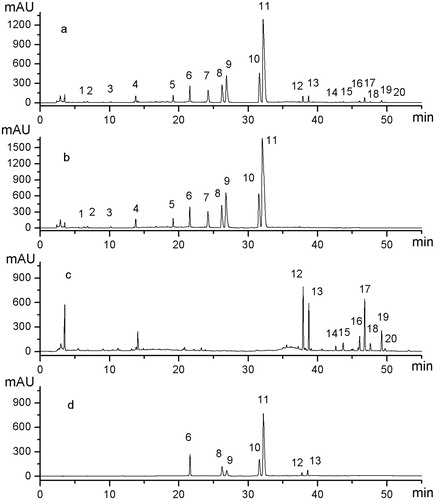
Table 1. Calibration curves, detection limits, precision, reproducibility, and stability of alkaloids determined by the HPLC method (n = 6).
Figure 4. Fingerprint chromatograms of 10 batches of ZJP samples which consisted of herbal drugs collected from different places and production methods. Sample Nos S1–S10 are ZJ tablet (Batch No. 20071101), ZJ capsule (Batch No. 080728), ZJ Pill (Batch No. 081001, No. 090501), C1E1, C2E1, C3E1, C1E2, C2E2, C3E2, respectively; R (representative standard fingerprint/mean fingerprint generated by Similarity Evaluation System for Chromatographic Fingerprint of TCM).
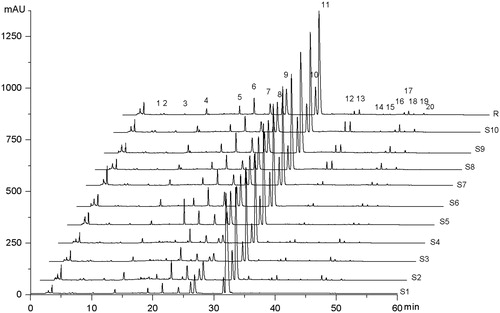
Table 2. RRT and RPA of characteristic peaks in 10 samples (relative data versus berberine).
Table 3. Recovery data by standard addition method (n = 3).
Figure 5. PCA scores plot of CEC and its related preparation samples from various sources on the first two PCs. Ten samples were clearly divided into three groups. S1 was the signal group in Group 1, and S2 in Group 2, and the other samples were in Group 3. Sample No. S1–S10 are ZJ tablet (Batch No. 20071101), ZJ capsule (Batch No. 080728), ZJ Pill (Batch No. 081001), ZJ Pill (Batch No. 090501), C1E1, C2E1, C3E1, C1E2, C2E2, C3E2; R (reference standard fingerprint generated by Similarity Evaluation System for Chromatographic Fingerprint of TCM).
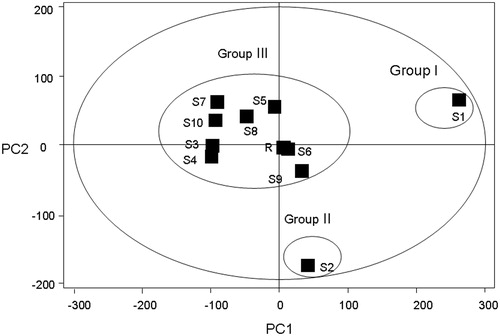
Figure 6. Loadings plot of PCA of CEC and its related preparation samples. Peak 92: berberine, 91: palmatine, 84: coptisine, 85: epiberberine, 81: unknown, and 73: jatrorrihzine.
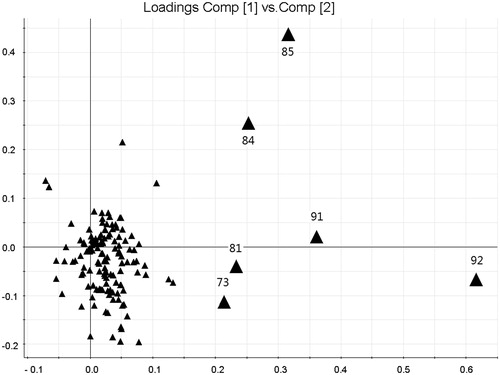
Table 4. Contents of seven alkaloids (mg/g) in the 10 collected commercial materials of CEC and Zuojin preparations (mean ± SD, n = 3).