Figures & data
Figure 1. Validation of EFT skin culture integrity. Representative EFT histological sections across the R-equol, racemic equol, and S-equol treatments for the gene array experiments are displayed at 10×, 20×, and 40× magnification. Marker bars are shown in the bottom left-hand corner in the frames. The skin sections were stained with hematoxylin/eosin and all treatment slides displayed intact and healthy epidermal layers (SC = stratum corneum and K = keratinocytes), dermal (fibroblasts) components, and epidermal/dermal borders.
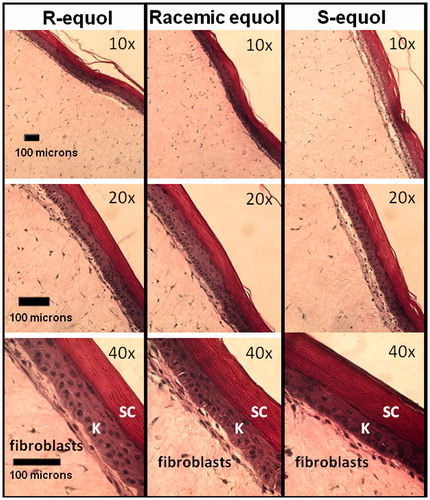
Figure 2. Percentage stimulation of COL1A1, ELN, and TIMP gene expression by the equol treatments compared to control values. Significantly greater stimulation compared to S-equol indicated by asterisk; significantly greater stimulation compared to R-equol or S-equol indicated by two triangles and significantly greater stimulation compared to R-equol indicated by diamond symbol.
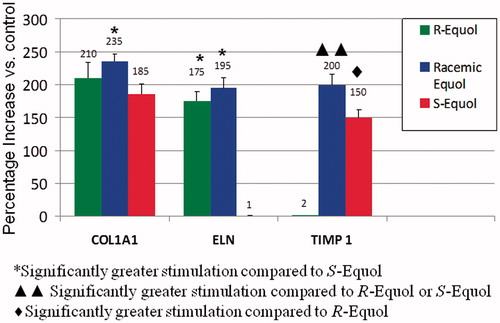
Figure 3. Percentage inhibition of MMPs gene expression by the equol treatments versus control values. Significantly greater inhibition compared to racemic equol or S-equol by two triangles and significantly greater inhibition compared to S-equol indicated by one triangle.
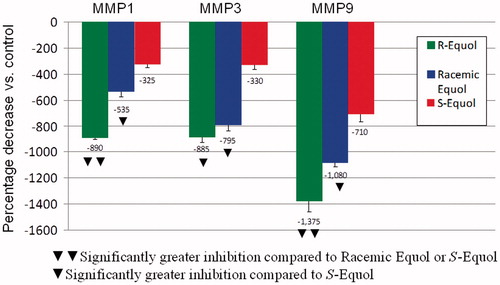
Figure 4. Skin antioxidant, growth factor, aging, and inflammatory biomarkers for: R-equol, racemic equol, and S-equol. Each gene symbol/name is color-coded indicating the equol form with the greatest (stimulation or inhibition) expression level. Less than symbol indicates significantly greater stimulation compared to R-equol; two less than symbol indicates significantly greater stimulation compared to racemic equol or R-equol; greater than symbol indicates significantly greater stimulation compared to S-equol; two greater than symbol indicates significantly greater stimulation compared to racemic equol or S-equol; square symbol indicates significantly greater stimulation compared to R-equol; diamond symbol indicates significantly greater inhibition compared to S-equol; two diamond symbol indicates significantly greater inhibition compared to R-equol or S-equol; two club symbol indicates significantly greater inhibition compared to racemic equol or S-equol; spade symbol indicates significantly greater inhibition compared to racemic equol or R-equol. About 1.2% equol (treatments: R-equol, racemic equol, or S-equol) in DMSO vehicle versus DMSO control levels; n = 6. Values represent percentage (%) increase or decrease versus control values, followed by pairwise comparisons among treatment groups (mean + SEM) of gene array analysis (via quantification of mRNA levels by TaqMan fluorescence detection), p < 0.005 for all data.
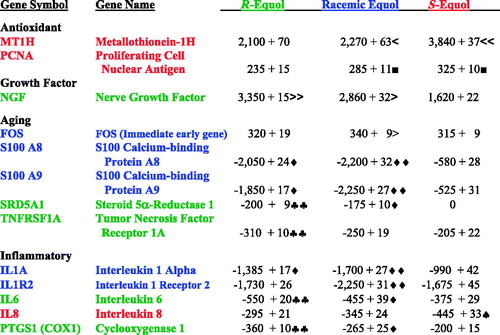
Figure 5. Collagen type I deposition in human monolayer fibroblasts in short-term (48 h) cultures via racemic equol, S-equol versus 17β-estradiol stimulation. Triangle symbol indicates significantly greater than all other treatments within dose (at 1 or 10 nM); asterisk symbol indicates significantly greater than DMSO control values at 1 nM; circle symbol indicates significantly greater than 17β-estradiol or DMSO controls at 10 nM; square symbol indicates significantly greater than DMSO control values at 10 nM. Collagen quantification via ELISA analysis, n = 6 per treatment group, ascrobate served as the positive control along with the natural steroid hormone, 17β-estradiol. DMSO served as the vehicle control for all equol or 17β-estradiol treatments. Cell viability via MTT assay among the treatments ranged from 85 to 95%. The data are expressed as the mean + SEM, p < 0.05.
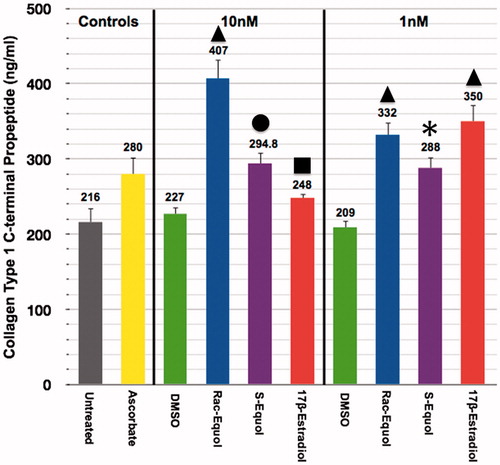
Figure 6. [3H]-Equol percutaneous absorption profile into human skin. [3H]-Equol was used to determine percutaneous absorption into human skin with a profile showing an initial maximum peak flux occurring 6 h after dosing followed by a decline with a secondary lower peak at ∼26–28 h after a single applied dose. Human trunk skin obtained from four individuals (two males and two females of Caucasian and Hispanic decent, aged 35–51 years, n = 3 per subject) were tested by Franz cell techniques. The SEM among the time point collections ranged from 0.005 to 0.024 (not shown graphically).
![Figure 6. [3H]-Equol percutaneous absorption profile into human skin. [3H]-Equol was used to determine percutaneous absorption into human skin with a profile showing an initial maximum peak flux occurring 6 h after dosing followed by a decline with a secondary lower peak at ∼26–28 h after a single applied dose. Human trunk skin obtained from four individuals (two males and two females of Caucasian and Hispanic decent, aged 35–51 years, n = 3 per subject) were tested by Franz cell techniques. The SEM among the time point collections ranged from 0.005 to 0.024 (not shown graphically).](/cms/asset/b6633774-6ee6-48d6-a49c-b83ab3a5ccda/iphb_a_793720_f0006_b.jpg)