Figures & data
Figure 1. DPPH radical scavenging activity of different solvent extracts (100–500 µg/mL) of S. wightii. The values are expressed as mean ± SD.
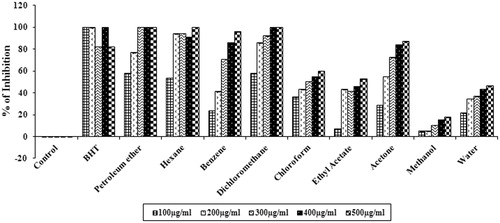
Figure 2. Reducing power of different solvent extracts of S. wightii (100–500 µg/mL). The values are expressed as mean ± SD.
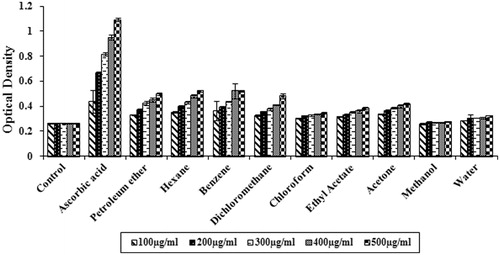
Figure 3. Hydroxyl radical scavenging effect of different solvent extracts of S. wightii (100–500 µg/mL). The values are expressed as mean ± SD.
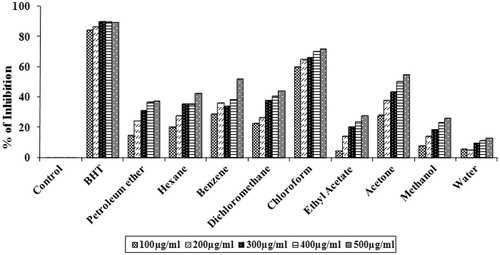
Figure 4. Hydrogen peroxide scavenging activities of different solvent extract of S. wightii (100–500 µg/mL). The values are expressed as mean ± SD.
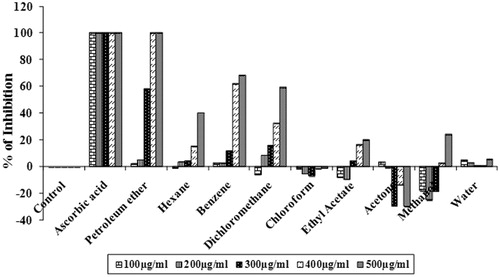
Figure 5. Total antioxidative power of different solvent extracts of S. wightii (100–500 µg/mL). The values are expressed as mean ± SD.

Table 1. AChE and BuChE inhibitory activities of different solvent extracts of S. wightii.
Table 2. GC-MS analysis of dichloromethane extract of S. wightii.
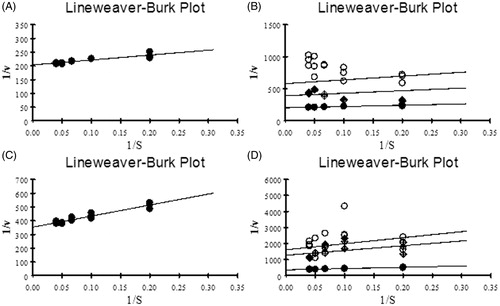
Figure 6. (A and C) LB plot of AChE and BuChE with various concentrations of ATCI and BTCI (5–25 mM) as substrates respectively; (B and D) LB plot showing inhibitory activity of dichloromethane extract of S. wightii against AChE and BuChE with ATCI and BTCI as substrates respectively. •– Control; ♦– IC25; ○– IC50; (1/v – Inverse of absorbance measured at 405 nm and 1/s – Substrate concentration).