Figures & data
Table 1. Body weight of different rat groups (mean ± SE).
Table 2. Effect of cod liver oil on liver function (mean ± SE).
Figure 1. Effect of cod liver oil on sodium nitrite-induced hepatocyte damage. Liver sections from different rat groups were stained with H/E and examined under a microscope (400 × magnification). (A) Sections from the control group showing hpatocytes radiating from the central vein (asterisk). Some hepatocytes appear binucleated (arrows). Blood sinusoids appear between the hepatocytes (arrow head). (B) Treated control group sections showing a portal tract containing a branch of portal vein (arrow) and a branch of hepatic artery (arrow head). (C) Sodium nitrite cussed disrupted endothelial lining of central vein (arrow head). Many hepatocytes appear with vacuolated cytoplasm (arrows). An area with disorganized liver cell is seen (asterisk). Cellular infilterate is present between hepatocytes (thick arrows). (D) Sections from rats treated with daily cod liver oil showing nearly normal appearance of hepatic lobule. Some hepatocytes appear with dark nuclei (arrow heads).
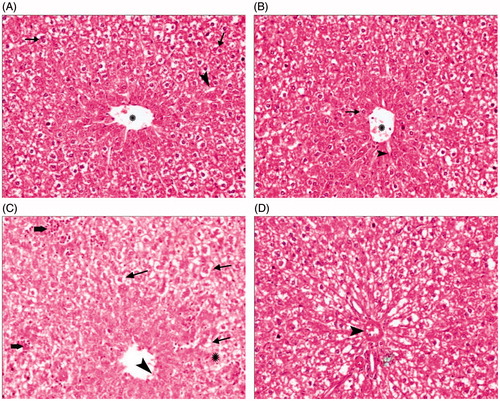
Figure 2. Effect of cod liver oil on sodium nitrite-induced drainage of connective tissue. Liver sections from different rat groups were stained with Mallory trichome and examined under a microscope (400 × magnification). (A) Sections from control group showing minimal amount of collagen fibers around the central vein (arrow). (B) Sections from treated control group showing minimal amount of collagen fibers in the portal tract (arrow). (C) Administration of sodium nitrite increased amount of collagen fibers surrounding a central vein (arrows). Delicate collagen fibers appear in the sinusoidal wall (arrow head). (D) Sections from rats treated with cod liver oil showing minimal collagen fibers surrounding a central vein (arrow) with an area exhibiting some increased fibers (arrow head).
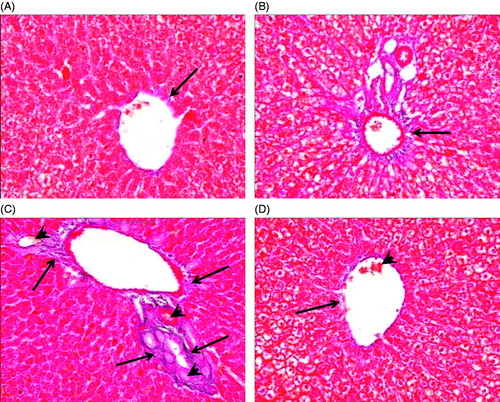
Table 3. Effect of cod liver oil on oxidative stress (mean ± SE).
Table 4. Effect of cod liver oil on antioxidant activity (mean ± SE).
Figure 3. Effect of cod liver oil on hepatic fibrosis. Statistical analysis showing significant increase in hepatic concentration of monocyte chemotactic protein (MCP)-1 in sodium nitrite group as compared with the control group (p < 0.05). Treatment with cod liver oil significantly reduced MCP-1 concentration in sodium nitrite group but still significantly higher than the control group. *: significant difference as compared with the rest of the groups at p < 0.05. #: significant difference as compared with the control groups at p < 0.05.
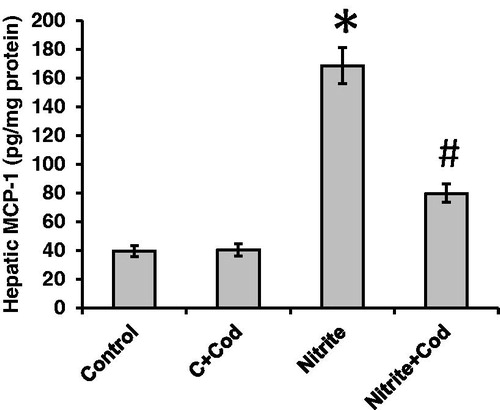
Table 5. Correlation between different measured parameters.
Figure 4. Effect of cod liver oil on hepatic cytochrome c oxidase activity. Statistical analysis showing about 38% reduction in hepatic cytochrome c oxidase in rats received sodium nitrite as compared with the control group. Treatment with cod liver oil restores cytochrome c oxidase activity in sodium nitrite group but did not affect the control rats. *: significant difference as compared with the rest of the groups at p < 0.05.
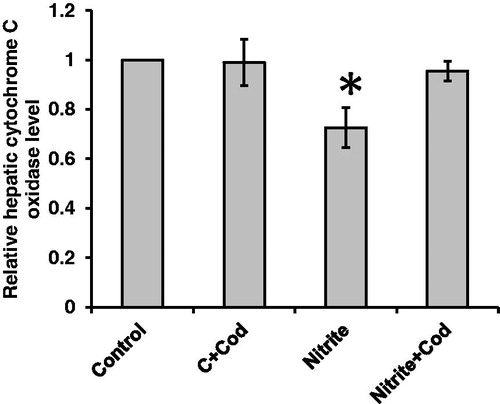
Figure 5. Effect of cod liver oil on hepatic DNA fragmentation. Statistical analysis showing significant increase in hepatic DNA fragmentation in sodium nitrite group as compared with the control group (p < 0.05). Treatment with cod liver oil significantly reduced the percent of DNA fragmentation in the sodium nitrite group but did not affect the control group. *: significant difference as compared with the rest of the groups at p < 0.05. #: significant difference as compared with the control groups at p < 0.05.
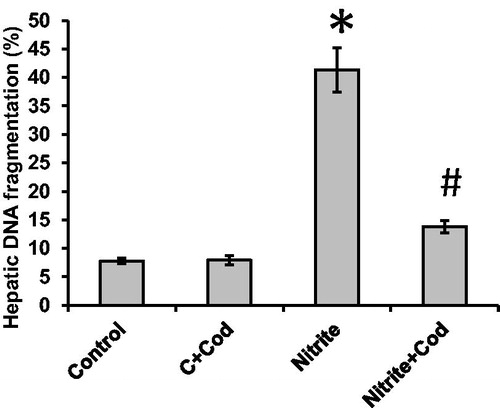
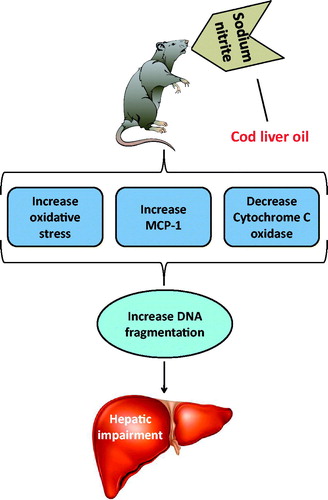
Figure 6. Schematic representation of the mechanism of hepatoprotective action of cod liver oil against sodium nitrite-induced liver damage.