Figures & data
Figure 1. Cytotoxicity of Pao in ovarian cancer cells. (A) Dose–response curves of ovarian cancer cells and non-cancerous cells to Pao. Human ovarian cancer cells SHIN-3, OVCAR-5 and OVCAR-8 were exposed to serial concentrations of Pao for 48 h, and cell viabilities were detected by MTT assay. An immortalized epithelial cell MCR-5 was subjected to the same treatment. IC50 was defined as the concentration of drug that inhibited cell growth by 50% relative to the vehicle-treated control. All values are expressed as means ± SD of three independent experiments each done in triplicates. (B) Colony formation of SHIN-3 cells in soft agar with and without Pao treatment. Five thousand SHIN-3 cells per well in 6-well plate were either treated with 400 µg/ml Pao (Pao) or vehicle containing DMSO (Control). No colonies were formed in the Pao-treated cells. All values are expressed as means ± SD of three independent experiments.
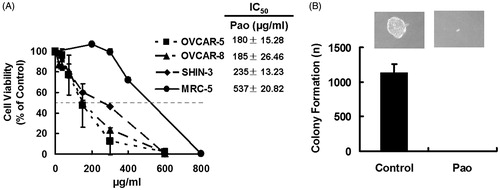
Figure 2. Apoptosis in ovarian cancer cells induced by Pao. (A) Flow-cytometry detection of apoptotic cells. Representative flow cytometry graphs were shown. SHIN-3 cells were treated with Pao at 0, 50, 100, 200 or 400 μg/ml for 48 h, and then subjected to FITC affiliated Annexin-V and PI double staining and flow cytometry. FITC positive cells (Q4, early apoptosis) and FITC/PI double positive cells (Q2, late apoptosis) were identified as apoptotic cells. The apoptosis rate was represented in the bar graph which presents means ± SD of three independent experiments. (B) Cleavage of caspase-8, caspase-3 and PARP in SHIN-3 cells treated with Pao. Cells were treated with Pao at indicated concentrations and time. The dose-dependent and time-dependent cleavage of caspase-8, caspase-3 and PARP were detected by western blots.
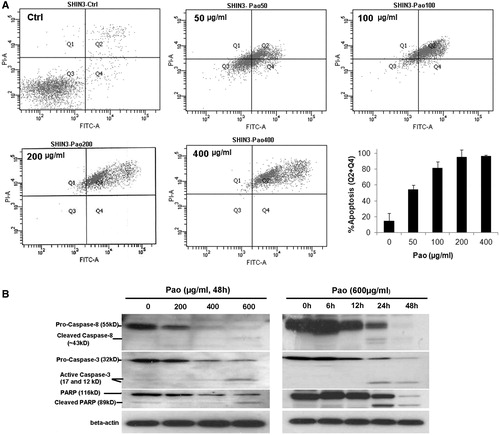
Figure 3. Effect of Pao and carboplatin combinations on ovarian cancer cells. (A–C) Ovarian cancer cells were treated with carboplatin (Cp, dotted line) and the combination of carboplatin and Pao (Cp + Pao, solid line) for 48 h. The combination took the molar ratio of IC50Pao:IC50Cp. Cell viabilities were plotted against carboplatin concentrations. All values are expressed as means ± SD of three independent experiments each done in triplicates. (D) Dose reduction index (DRI) for carboplatin across the fraction affected (fa) when Pao was combined.
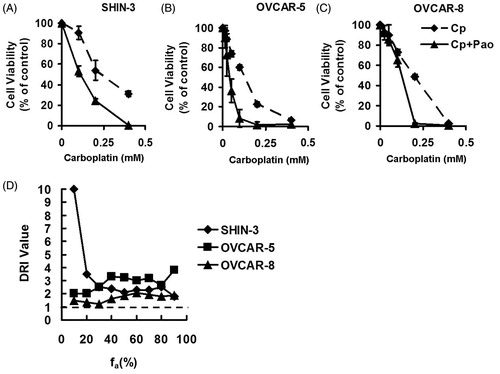
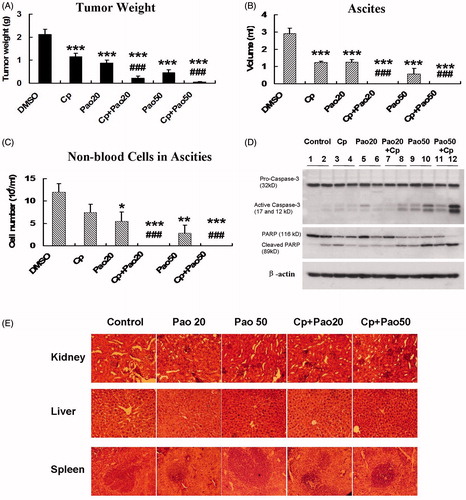
Figure 4. Effect of Pao and the combination of Pao and carboplatin against ovarian cancer in an intraperitoneal mouse model. SHIN-3 ovarian cancer cells (2.6 × 10⁶ cells) were intraperitoneally inoculated into nude mice. Seven days after tumor cell inoculation treatment commenced with i.p. injection of Pao at 20 mg/kg/day (Pao20) or 50 mg/kg/day (Pao50), carboplatin 15 mg/kg/week (Cp), and respective combinations of Pao and carboplatin (Cp + Pao20 and Cp + Pao50). Control mice were injected with 5% DMSO. Treatment lasted for 23 days. (A) Total tumor weight. (B) Volume of ascites. (C) Number of non-blood cells in the ascitic fluids, shown as an index of tumor cells in the ascites. (D) Cleavage of capase-3 and PARP in tumor samples from different treatment groups. (E) H&E staining of major organs from different treatment groups. Kidney, liver and spleen were collected from each treatment group and fixed in 4% formaldehyde and later subjected to histological analysis. (*p < 0.05, **p < 0.01, ***p < 0.001 relative to control group; #p < 0.05, ##p < 0.01, ###p < 0.001 relative to carboplatin treated group.)