Figures & data
Figure 1. HPLC–MS profile of the polyphenols obtained from ethanol extract of Haplophyllum tuberculatum aerial parts at 254 nm, 280 nm and 340 nm.
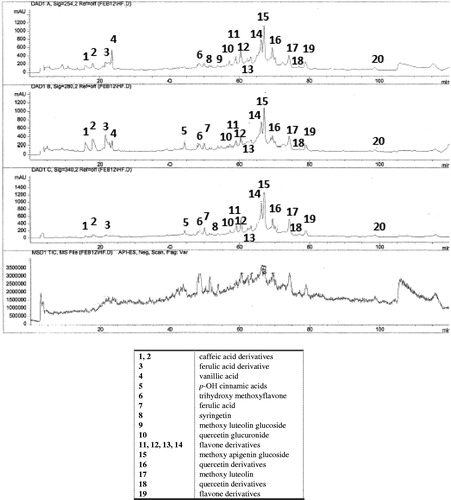
Figure 2. Effect of Haplophyllum tuberculatum ethanol extract on cell viability. U373-MG cells were treated with plant extract (range of concentrations from 0.025 to 250 µg/mL) for 24 h. Triton X-100 was employed as negative control. Results were expressed as mean of the percentage of control cells (100%) ± standard deviation (S.D.). *p < 0.05 versus control cells; $p < 0.05 versus ethanol extracts at all assayed concentrations.
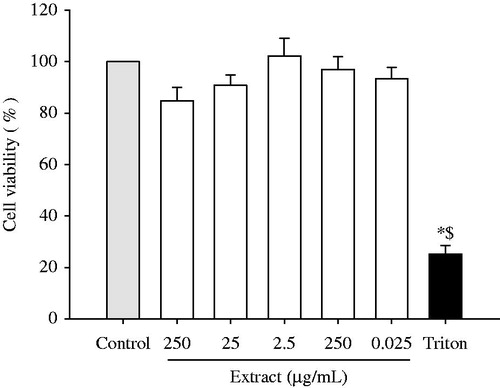
Figure 3. Protective effect of Haplophyllum tuberculatum ethanol extract against H2O2-induced loss in viability. U373-MG cells were treated with plant extract (range of concentrations from 0.025 to 250 µg/mL) for 24 h, prior to 1 mM H2O2 exposure (30 min). Triton X-100 was employed as negative control. Results were expressed as a mean of the percentage of control cells (100%) ± standard deviation (S.D.). *p < 0.05 versus control cells; #p < 0.05 versus H2O2.
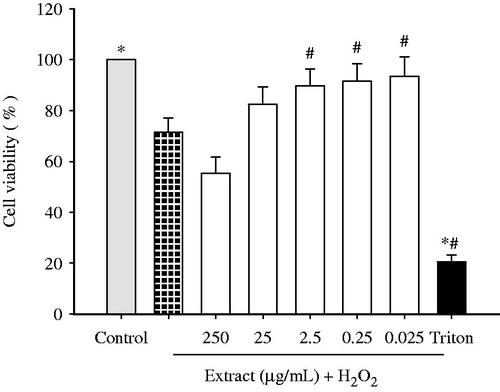
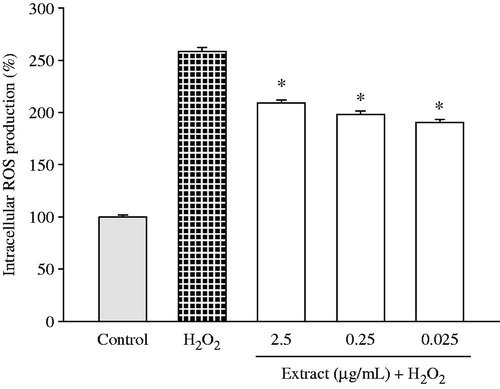
Figure 4. Protective effect of Haplophyllum tuberculatum ethanol extract against H2O2-induced intracellular ROS production. U373-MG cells were treated with plant extract (0.025, 0.25 and 0.025 µg/mL) for 24 h, prior to 1 mM H2O2 exposure (30 min). Results were expressed as a mean of the percentage of control cells (100%) ± standard deviation (S.D.). *p < 0.05 versus H2O2.