Figures & data
Figure 1. Chemical structure of berberine.
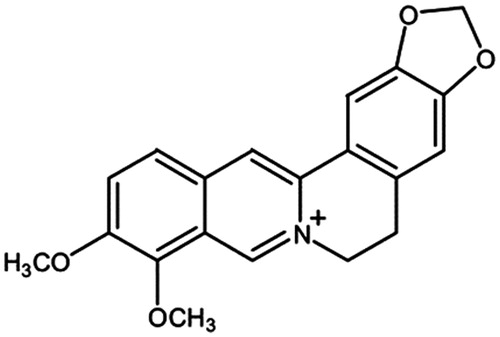
Table 1. Primer sequences for PCR.
Figure 2. Area under the curve of fasting blood glucose. (A) The tail vein-blood of all mice was collected at 30 min intervals over a 120 min period after a single intragastric administration of glucose solution at a dose of 2 g/kg for the glucose tolerance test to determine AUC of the fasting blood glucose using a glucometer. (B) The AUC of fasting blood glucose was calculated from 3–4 mice in the same group. A significant difference was determined by one-way ANOVA followed by Tukey post hoc test. *p < 0.01, **p < 0.001 versus NT-NT; #p < 0.01, ##p < 0.001 versus DM-NT.
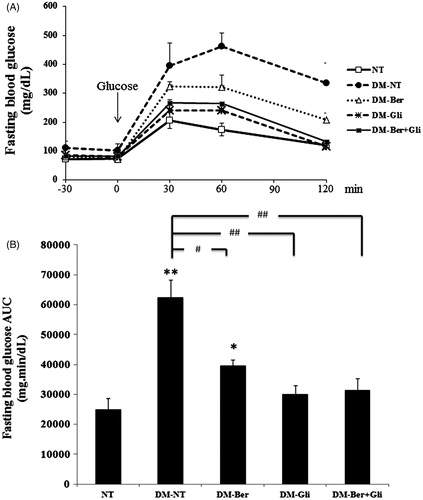
Table 2. The AUC level and blood glucose levels of normal and diabetic mice at 2 weeks after the treatments.
Figure 3. Expression of CuZn-SOD, Mn-SOD and CAT mRNA in mouse livers. Once a day, both the normal (NT) and the diabetic mice (DM) were given glibenclamide intragastrically (Gli, 10 mg/kg/d) and/or berberine (Ber, 100 mg/kg/d) or PBS (NT), respectively, for 2 weeks. Mice were sacrificed 24 h after the last treatment and the livers were immediately excised to prepare total RNA. Semi-quantitative determination of mRNA expression was performed using a pair of primers specific to the investigated genes as described. The data are presented as the mean ± SD (n = 5). A significant difference was determined by one-way ANOVA followed by Tukey post hoc test. *p < 0.01, **p < 0.001 versus NT-NT; #p < 0.01 versus DM-NT.
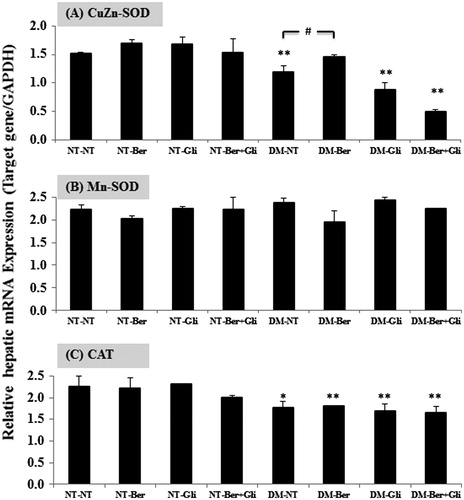
Figure 4. Effect of berberine and/or glibenclamide on the level of TBARSs in mouse (A) liver (B) brain and (C) kidneys. Once a day, both the normal (NT) and the diabetic mice (DM) were given glibenclamide intragastrically (Gli, 10 mg/kg/d) and/or berberine (Ber, 100 mg/kg/d) or PBS (NT), respectively, for 2 weeks. Mice were sacrificed 24 h after the last treatment and the livers, brains and kidneys were immediately excised to examine the levels of TBARs as described. The data are presented as the mean ± SD (n = 5). A significant difference was determined by one-way ANOVA followed by Tukey post hoc test. *p < 0.01 versus NT-NT; #p < 0.01 versus DM-NT.
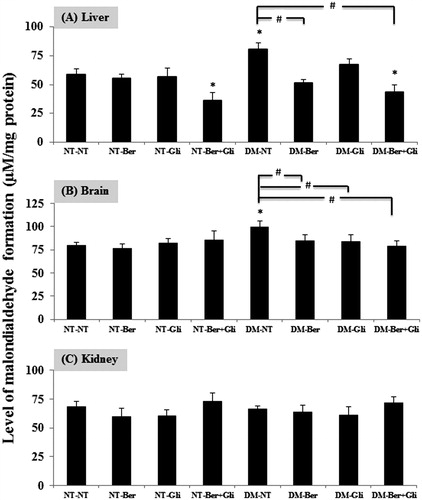
Figure 5. Effect of berberine and/or glibenclamide on the activities of SOD in the mouse liver (A), brain (B) and kidneys (C). Both the normal (NT) and the diabetic mice (DM) were daily given glibenclamide intragastrically (Gli; 10 mg/kg/d) and/or berberine (Ber, 100 mg/kg/d) or PBS (NT), respectively, for 2 weeks. Mice were sacrificed 24 h after the last treatment and the livers, brains and kidneys were immediately excised to examine the activity of SOD enzymes as described. The data are presented as the mean ± SD (n = 5). A significant difference was determined by one-way ANOVA followed by Tukey post hoc test. *p < 0.01, **p < 0.001 versus NT-NT; #p < 0.01, ##p < 0.001 versus DM-NT.
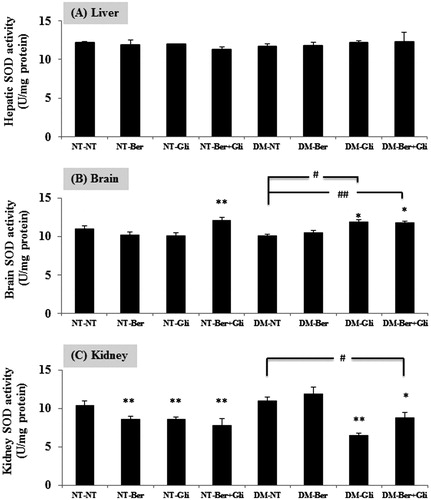
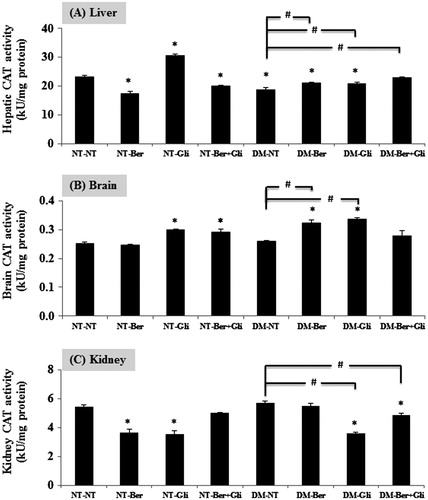
Figure 6. Effect of berberine and/or glibenclamide on the activities of CAT in mouse liver (A), brain (B) and kidneys (C). Once a day, both the normal (NT) and the diabetic mice (DM) were given glibenclamide intragastrically (Gli, 10 mg/kg/d) and/or berberine (Ber, 100 mg/kg/d) or PBS (NT), respectively, for 2 weeks. Mice were sacrificed 24 h after the last treatment and the livers, brains and kidneys were immediately excised to examine the activity of CAT enzymes as described. The data are presented as the mean ± SD (n = 5). A significant difference was determined by one-way ANOVA followed by Tukey post hoc test. *p < 0.01 versus NT-NT; #p < 0.01 versus DM-NT.