Figures & data
Table 1. Daily dosage schedule for each experimental group for a period of 21 d.
Figure 1. Percent loss in the mean body weight on last day of study period in control-, gentamicin- and extracts-treated groups.
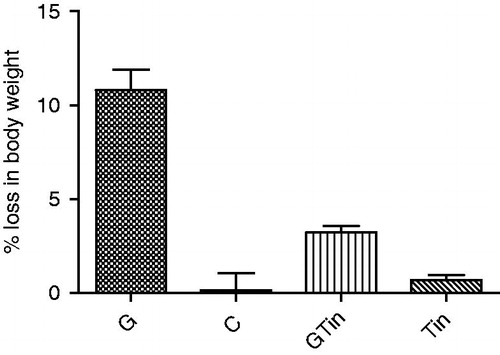
Table 2. Estimation of blood urea nitrogen, serum creatinine, creatinine clearance, serum uric acid and percent loss in body weight on last day of study period.
Table 3. Estimation of serum electrolytes and urinary protein excretion in experimental groups.
Table 4. Measurement of urinary volume and excretion of lactate dehydrogenase and alkaline phosphatase on last day study period.
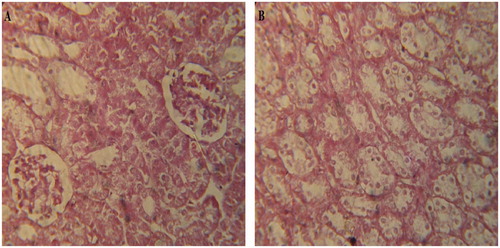
Figure 2. Photomicrographs of group G (gentamicin treated): (A) renal cortex showing renal cortex presenting glomerular atrophy with hydropic changes and proximal tubular cell necrosis and loss of cellular pattern and (B) renal medulla showing loss of cellular pattern with a number of ruptured tubules; the dilated collecting tubules also significantly present.
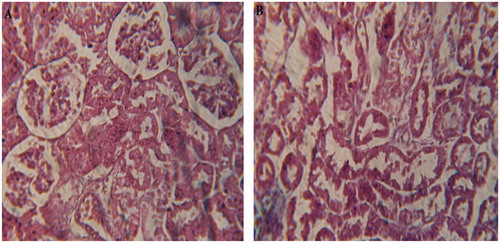
Figure 3. Photomicrographs of control group: (A) renal cortex presenting no common abnormality like glomerular atrophy or necrosis and (B) renal medulla shows normal proximal and distal tubules with no significant abnormality.
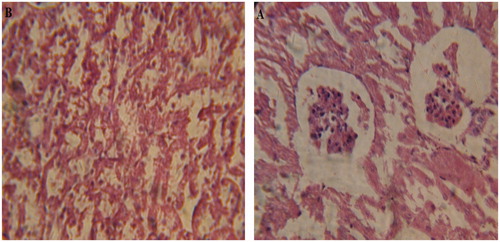
Figure 4. Photomicrographs of group GTin (Gentamicin + T. indica extract treated): (A) renal cortex presenting normal glomeruli with no evidence of necrosis, but small number of vacuoles in the proximal tubular cells and (B) renal medulla presenting normal tubules with no presence of hyaline and granular casts.
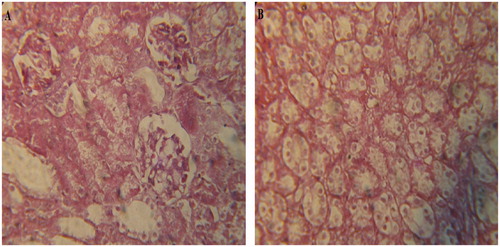
Figure 5. Photomicrographs of group Tin (T. indica extract treated): (A) renal cortex presenting normal glomeruli and tubules. No common abnormality was identified and (B) renal medulla also presenting normal tubules with no hydropic changes or ruptured tubules.