Figures & data
Figure 1. Chemical structure of HSYA.
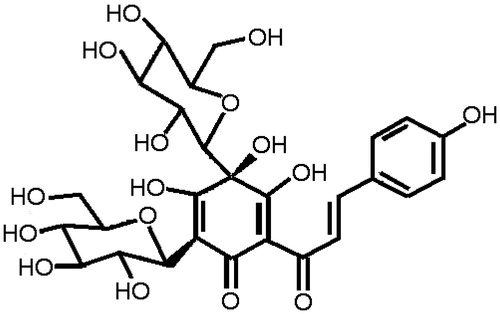
Table 1. Primers used for real-time PCR detection of gene expression.
Figure 2. HSYA inhibit culture-activated HSC viability in a dose- and time-dependent manner. Culture-activated HSC were either treated with HSYA at indicated concentrations for 48 h (A), or HSYA at 30 µM for the indicated times (B), and then assayed for cell viability using the MTS assay. Cell viability was expressed as percentage changes compared to that in the control either without HSYA treatment (A) or at the time 0 (B). Data represent means ± SD of three separate experiments. Significance is defined as follows: *p < 0.05 compared with control by ANOVA.
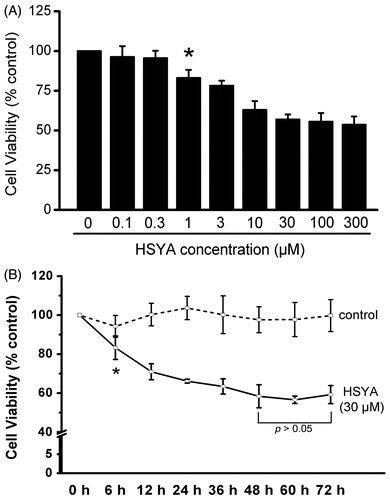
Figure 3. HSYA suppresses Col I and Col III collagen in culture-activated HSC. Culture-activated HSC, after serum-starvation for 24 h, were treated with HSYA (30 µM), XMD 8–92, or a combination of HSYA and XMD 8–92 for 48 h, then cell and culture supernatants were harvested. (A) Collagen type I secretion was measured in culture supernatants by ELISA, and concentrations were calculated by means of a standard curve. (B) HSC lysates were then subjected to Western blotting to evaluate COL1A1, and blots were reprobed with antibody against GAPDH to assure equal sample loading. The blots shown are representatives of three independent experiments with similar results. (C) The density of bands representing COL1A1 was quantified by densitometric scanning from three independent experiments. Total RNA extracted from culture-activated HSC was used to determine mRNA expression of Col I (D) and Col III (E) by real-time PCR and normalized to the expression of GAPDH. Results represent means ± SD of three separate experiments. Significance is defined as follows: *p < 0.05 compared with control; §p < 0.05 compared with cells treated with HSYA alone by ANOVA.
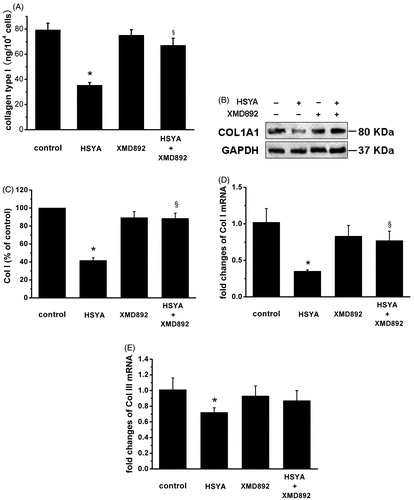
Figure 4. HSYA suppresses α-SMA gene expression in culture-activated HSC. Culture-activated HSC, after serum-starvation for 24 h, were treated with HSYA (30 µM), XMD 8–92 or combination of HSYA and XMD 8–92 for 48 h, then cell were harvested. (A) HSC lysates were then subjected to Western blotting to evaluate α-SMA and blots were reprobed with antibody against GAPDH to assure equal sample loading. The blots shown are representatives of three independent experiments with similar results. (B) The density of bands representing α-SMA was quantified by densitometric scanning from three independent experiments. (C) Total RNA extracted from culture-activated HSC was used to determine mRNA expression of α-SMA by real-time PCR and normalized to the expression of GAPDH. Results represent means ± SD of three separate experiments. Significance is defined as follows: *p < 0.05 compared with control; §p < 0.05 compared with cells treated with HSYA alone by ANOVA.
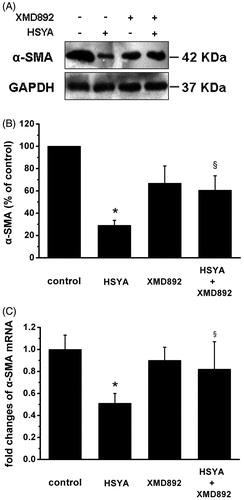
Figure 5. HSYA suppresses MEF2C gene expression in culture-activated HSC. Culture-activated HSC, after serum-starvation for 24 h, were treated with HSYA (30 µM), XMD 8–92 or combination of HSYA and XMD 8–92 for 48 h, then cell were harvested. (A) HSC lysates were then subjected to Western blotting to evaluate MEF2C, and blots were reprobed with antibody against GAPDH to assure equal sample loading. The blots shown are representatives of three independent experiments with similar results. (B) The density of bands representing MEF2C was quantified by densitometric scanning from three independent experiments. (C) Total RNA extracted from culture-activated HSC was used to determine mRNA expression of MEF2C by real-time PCR and normalized to the expression of GAPDH. Results represent means ± SD of three separate experiments. Significance is defined as follows: *p < 0.05 compared with control; §p < 0.05 compared with cells treated with HSYA alone by ANOVA.
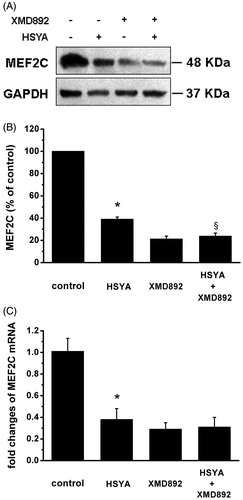
Figure 6. HSYA suppresses phosphorylation of ERK5 in culture-activated HSC. Culture-activated HSC, after serum-starvation for 24 h, were treated with HSYA (30 µM), XMD 8–92 or a combination of HSYA and XMD 8–92 for 48 h, then cell were harvested. (A) HSC lysates were then subjected to Western blotting to evaluate phosphorylation of ERK5, and blots were reprobed with antibodies against total ERK5 and also GAPDH to assure equal sample loading. The blots shown are representatives of three independent experiments with similar results. (B) The density of bands representing phosphorylated ERK5 was quantified by densitometric scanning from three independent experiments. (C) Cell viability was determined using the MTS assay, and untreated cells were assumed to be vital (100% viability). Results represent means ± SD of three separate experiments. Significance is defined as follows: *p < 0.05 compared with control; §p < 0.05 compared with cells treated with HSYA alone by ANOVA.
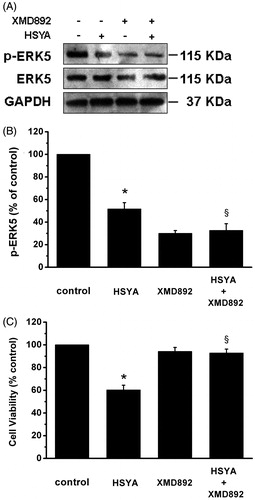
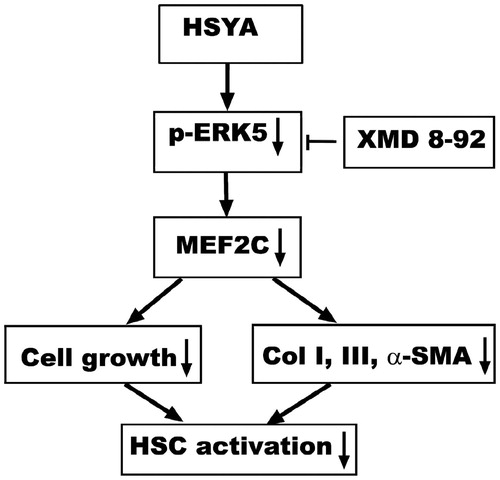
Figure 7. A schematic diagram of the role of the HSYA interruption of ERK5-MEF2C signaling pathway in culture-activated HSC. HSYA blocks ERK5 phosphorylation and depress the gene expression of the downstream inter-mediators MEF2C, reduces proliferation and activation of HSC.