Figures & data
Figure 1. The structure of BBR (chemical formula: C20H18NO4, molecular weight: 336.36).
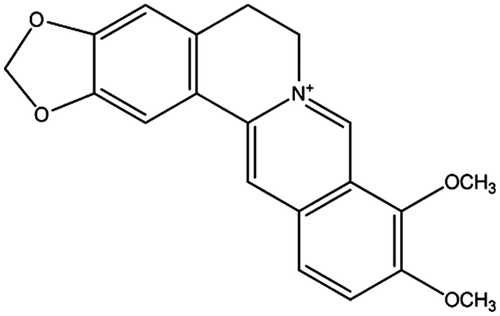
Figure 2. Effect of BBR on LPS-induced celll viability in NIT-1 or INS-1 cells. Cells were treated with BBR at a concentration of 0.1813, 0.3625, 0.625, 1.25, 2.5, 5.0 and 10.0 μM in the presence of 1 μg/ml LPS. MTT assay was preformed in NIT-1 cells (A and B) while colony formation assays were preformed in NIT-1 cells and INS-1 cells (C). The OD value of samples was detected by MTT method at 570 nm. Data are expressed as mean ± SD (n = 18). **p < 0.01 versus blank; #p < 0.05, ##p < 0.01 versus LPS.
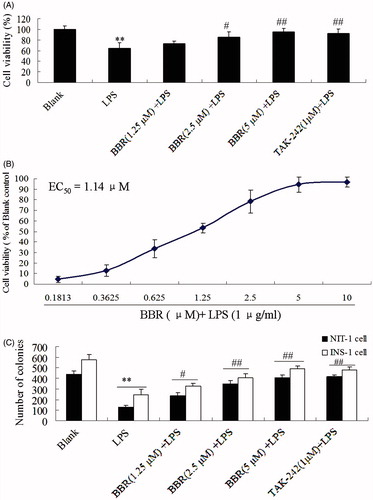
Table 1. Effect of BBR on LPS-induced inflammatory cytokines and insulin level (n = 12).
Figure 3. Effects of BBR on cell cycle distribution and apoptosis in cultured NIT-1 cells. Flow cytometric analysis of the DNA content in control (Aa), LPS-treated model group (Ab), BBR of 2.5 μM (Ac) and 5.0 μM (Ad), TAK-242 of 1 μM (Ae) or SP-600125 of 1 μM (Af). (A) PI staining and flow cytometric analysis of cell cycle distribution in treated NIT-1 cells. (B) Relative apoptosis ratio.
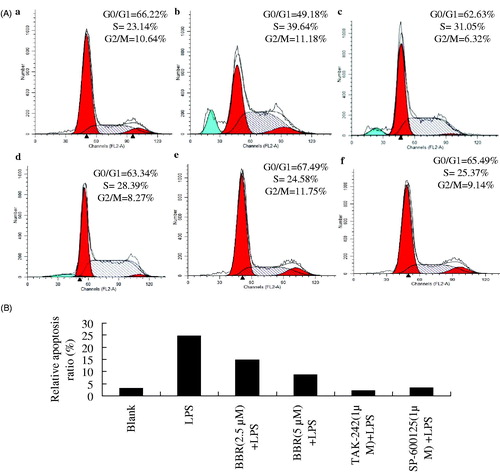
Figure 4. BBR attenuated JNK/NF-κB pathway in NIT-1 cells involving the inflammation response. NIT-1 cells were treated with BBR (1.25 μM, 2.5 μM and 5.0 μM), TAK-242 (1 μM) or SP-600125 (1 μM) before LPS stimulation (100 ng/ml). p-JNK (1:1000) and p65 NF-κB (1:1000) expression was detected by Western blot. β-Actin (1:1000) was used for internal reference. (A) The brands of p-JNK and p65 NF-κB; (B) the relative level of p-JNK and p65 NF-κB. Data are taken from individual experiments and expressed as mean ± SD (n = 3). **p < 0.01 versus blank control; #p < 0.05, ##p < 0.01 versus LPS alone; $$p < 0.01 versus LPS alone.
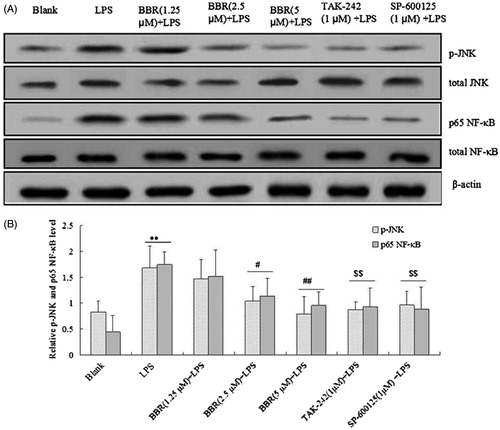
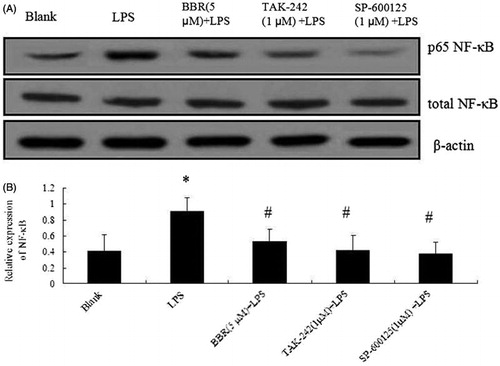
Figure 5. Effect of BBR on NF-κB expression in INS-1 cells. Cells were treated with BBR (5μM), TAK-242 (1 μM) and SP-600125 (1 μM) prior to LPS stimulation (100 ng/ml). (A) Expression of NF-κB in INS-1 cells by Western blotting. (B) Relative expression ratio of NF-κB. Data are expressed as mean ± SD (n = 3). *p < 0.05 versus blank; #p < 0.05 versus LPS.