
Figures & data
Figure 1. Avocado extract induces nuclei fragmentation, exposure of phosphatidylserine on the outside surface of plasma membrane and mitochondrial membrane depolarization in leukemic cells as indicative of apoptosis process. Jurkat cells were either left untreated, treated with TPEN (5 μM, as positive control) or incubated with two concentrations (0.1–0.5 mg/mL) of avocado extract: En, Se, Ws and Le for 24 h. Illustration shows (A) normal, (B and E) early, (C and F) late apoptotic and (D) necrotic nuclei morphologic changes indicative of apoptosis (B, C, E and F) and necrosis (D) in Jurkat cells exposed to avocado extract (B, C and D) or TPEN (E and F), as evaluated by AO/EB staining. Figure (G and H) represents percentage of cells with normal, apoptotic and necrotic nuclei (AO/EB staining), percentage of exposure of phosphatidylserine from the inside to the outside surface of the plasma membrane, as evaluated by AV/7AAD assay, and Δψm depolarization percentage, as evaluated using DiOC6(3). The ANOVA showed significant differences among the groups, p < 0.001. The Bonferroni comparison test showed significant differences in a percentage of induction of apoptosis between each treatment versus untreated, **p < 0.0001. NOR = normal, NEC = necrosis, APO = apoptosis.
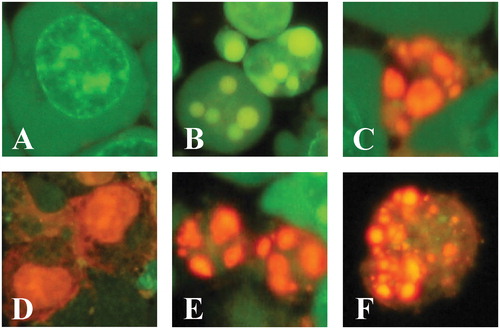
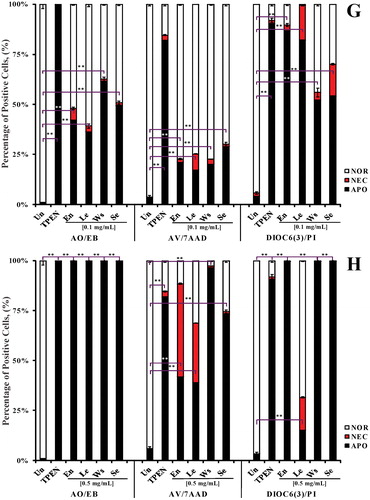
Figure 2. Comparison of apoptosis-induced avocado extract (0.1 mg/mL) in Jurkat cells evaluated by three different techniques: AO/EB (A–F), AV/7AAD (A′–F′) and DiOC6(3) (A″–F″). The circles represent the percentages of total apoptosis (early and late apoptosis) produced by each treatment. Insets in A, B, C, D, E and F showed nuclear fragmentation typical of apoptosis.
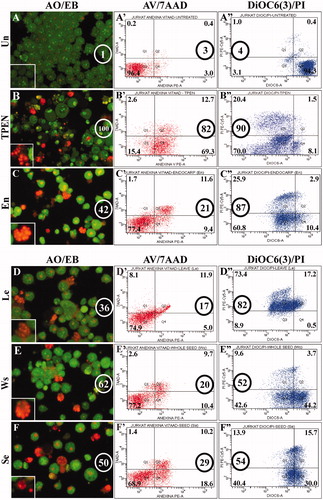
Figure 3. En, Se, Ws and Le extracts induce simultaneous activation of the transcription factor p53, protease caspase-3 and AIF in Jurkat cells. Jurkat cells were either left untreated (A, B and C), treated with TPEN (5 μM; D, E and F) or exposed to 0.1 mg/mL En (G, H and I); Le (J, K and L); Ws (M, N and O) and Se (P, Q and R), at 37 °C for 24 h. After this time of incubation, cells were stained with anti-p53 (A, D, G, J, M and P), anti-caspase-3 (B, E, H, K, N and Q) and anti-AIF (C, F, I, L, O and R) antibodies. Notice that p53, caspase-3 (CAS-3) and AIF+ nuclei (dark brown color in the online version, black color in printed version) reflect their nuclear translocation/activation and appear to correlate with the apoptotic nuclear morphology, i.e. condensed/fragmented nuclei compared with untreated cells (A, B and C) or cytoplasmic activation (brown color in the online version, black color in printed version). Magnification 660× (A–R).
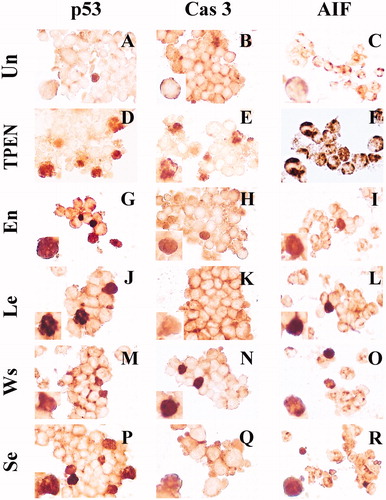
Figure 4. Avocado extracts induce activation of the transcription factor p53, protease caspase-3 and AIF in Jurkat cells. Jurkat cells were either left untreated, treated with TPEN (5 μM) or incubated with 0.1 mg/mL of avocado extract: En, Se, Ws and Le at 37 °C for 24 h. The ANOVA showed significant differences among the groups, p < 0.001 in each strata (e.g., AO/EB). The Bonferroni comparison test showed significant differences in a percentage of DAB+ cells. A *p < 0.0001 showed differences between treated and untreated cells.
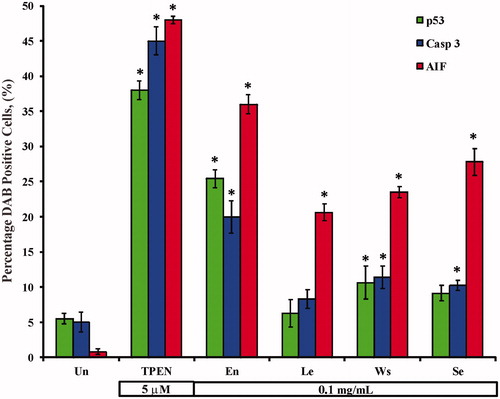
Table 1. Hydrogen peroxide (H2O2) is involved in avocado toxic effect of ethanol extracts on Jurkat leukemia cells.