Figures & data
Figure 1. Worldwide reliance in CAM systems including homeopathy. Among four major CAM systems, homeopathy is the most second accepted alternative method of treatment among adults. The highest percentage of homeopathy acceptance is in India (62%) followed by Brazil (58%), Saudi Arab (53%), UAE (49%), Chile (49%) and France (40%). Respondents are 18 years of age and above from ABC socio-economic group of urban areas. The percentage of acceptance is a clear indication of rise of interest in homeopathy as alternative method of treatment of various diseases.
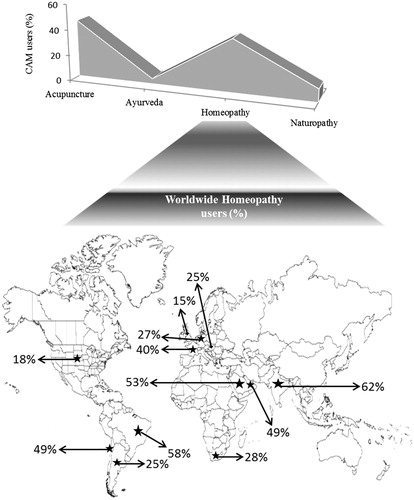
Table 1. Habb-e-Asgand constituents (batch size; 120 kg).
Table 2. Habb-e-Asgandh physico-chemical analysis.
Figure 2. Blood serum enzyme levels of control, Habb-e-Asgand (HA), paracetamol (P) and Habb-e-Asgand + (HA + P) exposed Swiss albino mice. The values are expressed as means ± SE (n = 5). Enzymes level was measured as U/L for alkaline phosphatase (ALP) and IU/L for SGOT and SGPT which are expressed here as percent change with respect to the control group. The p values observed were *p < 0.05 and ***p < 0.001 when compared with control group values. ###p < 0.001 when values compared with the paracetamol-treated group.
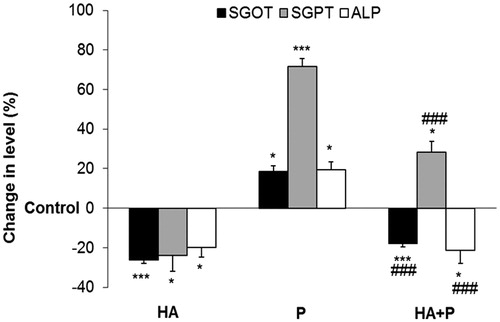
Figure 3. Total bilirubin values in serum of control and Habb-e-Asgand (HA), paracetamol (P) and Habb-e-Asgand + paracetamol (HA + P) exposed Swiss albino mice. The values are expressed as means ± SE (n = 5). The values obtained as mg% which are expressed here as percent change with respect to the control group. The p values observed were **p < 0.01 and *** p < 0.001 when compared with control group values. ###p < 0.001 when values compared with the paracetamol-treated group.
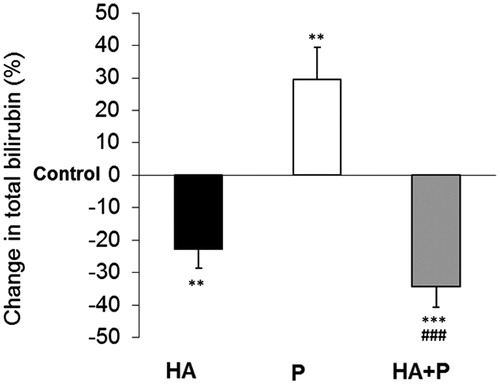
Table 3. Habb-e-Asgand effect on liver enzymatic antioxidants against paracetamol drug toxicity.
Figure 4. GSH values in liver of control and Habb-e-Asgand (HA), paracetamol (P) and Habb-e-Asgand + paracetamol (HA + P) exposed Swiss albino mice. The values are expressed as means ± SE (n = 5). GSH values obtained as nmole GSH/g tissue which are expressed here as percent change with respect to the control group. The significance levels observed is **p < 0.01 and ***p < 0.001 when compared with control group values and ###p < 0.001 when compared with the paracetamol-treated group.
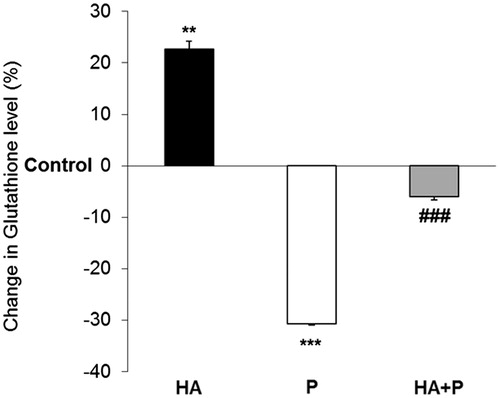
Figure 5. Cytochrome P450 values in liver of control and Habb-e-Asgand (HA), paracetamol (P) and Habb-e-Asgand + paracetamol (HA + P) exposed Swiss albino mice. The values are expressed as means ± SE (n = 5). Values obtained as nmole of CYP /mg protein which are expressed here as percent change with respect to the control group. The significance levels observed is ***p < 0.001 when compared with control group values and ###p < 0.001 when compared with the paracetamol-treated group.
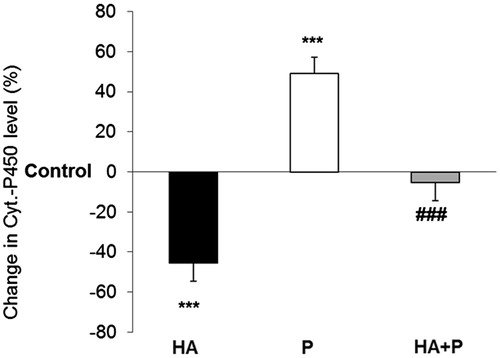
Figure 6. LPO values in liver of control and Habb-e-Asgand (HA), paracetamol (P) and Habb-e-Asgand + paracetamol (HA + P) exposed Swiss albino mice. The values are expressed as means ± SE (n = 5). LPO values obtained as nmole of TBARS formed/mg tissue which are expressed here as percent change with respect to the control group. The significance levels observed is **p < 0.01 and ***p < 0.001 when compared with control group values and ###p < 0.001 when compared with the paracetamol-treated group.
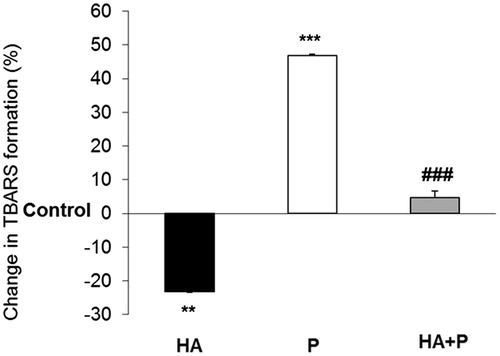
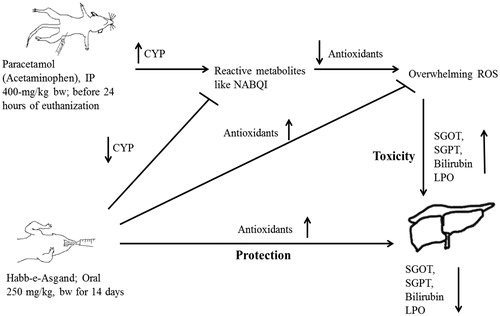
Figure 7. Schematic presentation of possible mechanism of Habb-e-Asgand liver protection against paracetamol (acetaminophen) induced toxicity. Up arrows are to show increase while down arrows to show decrease. It is proposed that paracetamol is converted into a reactive metabolite through CYP and thus suppresses the antioxidant system and results in over production of ROS and thus liver toxicity. Habb-e-Asgand by decreasing cytochrome P450 and increasing the antioxidant levels is protecting liver against paracetamol reactive metabolites such as NAPQI induced overwhelming production of ROS-mediated toxicity.