Figures & data
Table 1. Primers used in RT-PCR analysis.
Figure 1. OA inhibits viability of gastric cancer cells. MKN28 cells were pretreated with OA at the doses of 5, 10, 20, 40, 80 and 160 μg/mL for 12 and 24 h. The results displayed that OA significantly inhibited MKN28 cell viability in a time- and dose-dependent manner with IC50 of 44.8 and 15.9 μg/mL, respectively. **, ΔΔ p < 0.01 compared with the control group. Data are expressed as the mean ± SD. n = 8.
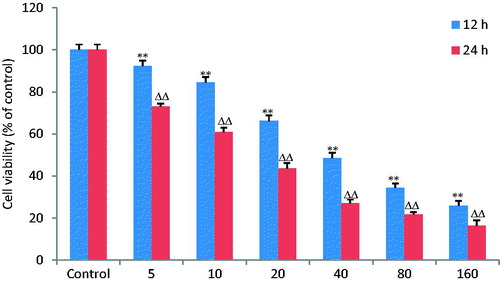
Figure 2. OA increases the apoptotic percentage of MKN-28 cells. The lower left quadrant shows vital cells. The lower right quadrant indicates early apoptotic cells (AV positive but PI negative). The upper right quadrant represents late apoptotic cells or necrotic cells (double positive).
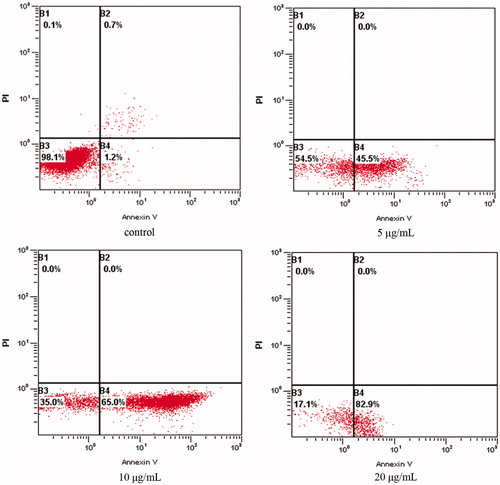
Figure 3. OA induces nueclear morphologic alterations of cells. After treatment with OA (5, 10, 20 μg/mL) for 24 h, cells were stained by Hoechst 33258. (A) Normal nuclei are symmetrical baby blue. (B)–(D) Fragmented nuclei displaying bright blue are presented in the advanced stage of apoptosis.
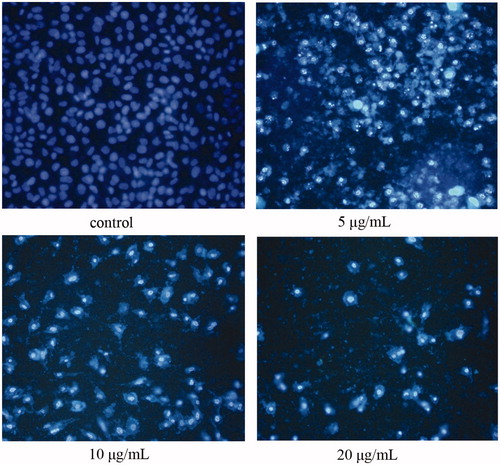
Figure 4. OA disrupts mitochondrial membrane potential (Δψm). MKN28 cells were incubated with 5, 10 and 20 μg/mL OA for 12 h. For image analysis of Δψm, the JC-1-stained cells were mounted onto microscope slide in mounting medium. OA-treated cells exhibited a significant and dose-dependent decrease in the mitochondrial membrane potential in the right pane when compared with the control group.
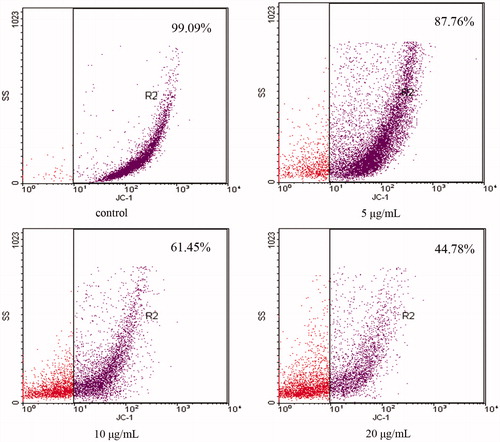
Figure 5. Effects of OA on expression of key proteins involved in cell apoptosis. (A) Treatment with OA (5 and 10 μg/mL) for 1 h, JNK phosphorylation increased and AKT phosphorylation decreased dose dependently. (B) The effects of OA on phosphorylation of P38 and ERK were not observed. (C) Treatment with OA (5 and 10 μg/mL) for 12 h increased the expression of caspase 3, caspase 9 and Apaf-1 dose dependently. Δp < 0.05. **, ΔΔ, †† p < 0.01 compared with the control group. Data are expressed as the mean ± SD. n = 3.
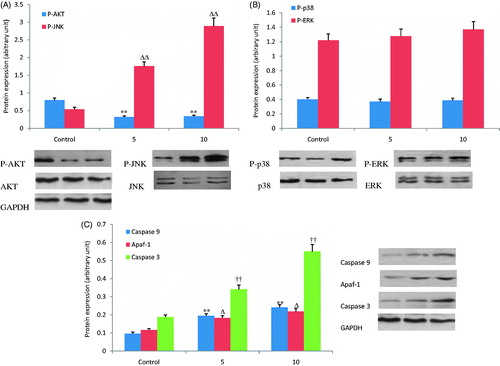
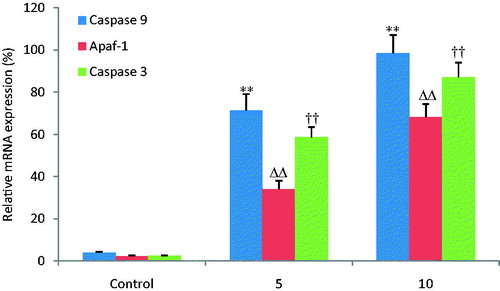
Figure 6. OA increases the relative mRNA expression of caspase -3, -9 and Apaf-1. The mRNA expression of caspase 3, caspase 9 and Apaf-1 was detected by FQRT-PCR. OA increased the mRNA expression levels of caspase 3, caspase 9 and Apaf-1 dose dependently when compared with the control group. **, ΔΔ, †† p < 0.01 compared with the control group. Data are expressed as the mean ± SD. n = 6.